Before I get started, if you haven’t read my first article on premium and discount zones, please do so before you proceed.
In this article, I’m going to be building off of the fundamental concepts I laid out in part one of “Premium vs. Discount Zones”.
Let’s go over a quick recap:
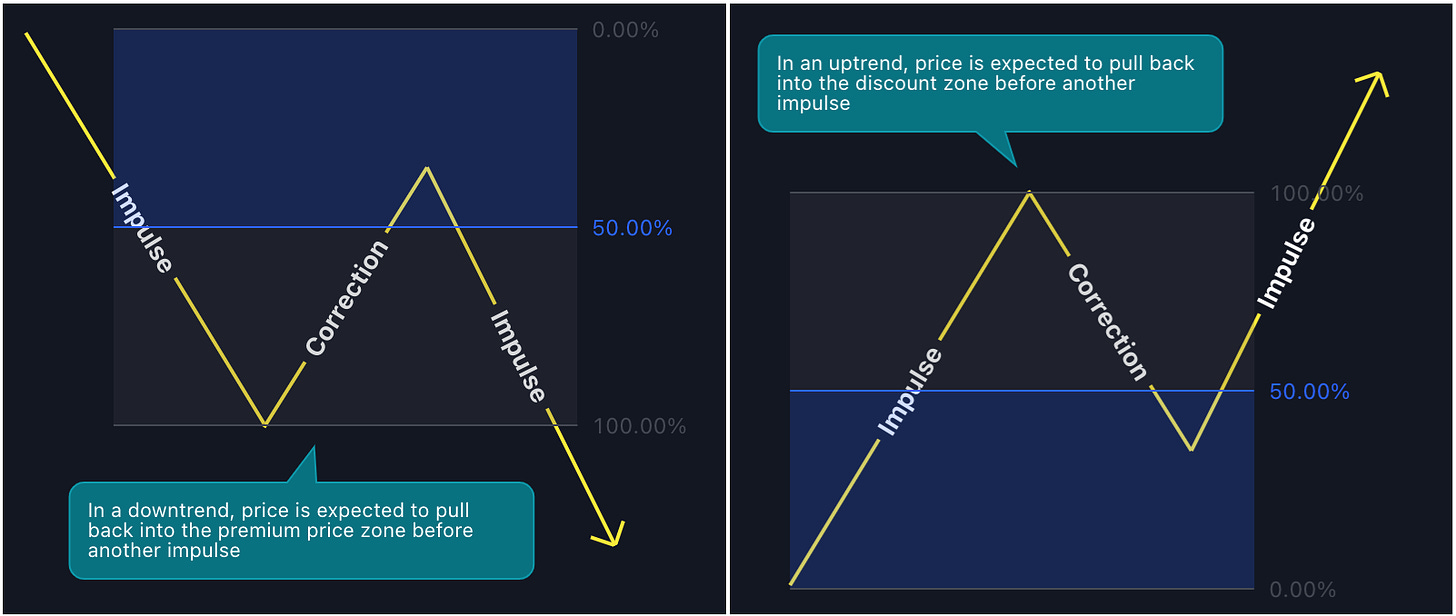
Price action is made up of impulses and corrections
Using the 50% fib retracement, we can determine premium and discount prices within an impulse
Anything above the 50% fib line (EQ) is known as the premium price zone
Anything below the 50% fib line (EQ) is know as the discount price zone
In an uptrend, after a bullish BOS, price is expected to pull back into the discount price zone before another impulse occurs
In a downtrend, after a bearish BOS, price is expected to pull back into the premium price zone before another impulse occurs
When price is in the premium zone, short trades are higher probability
When price is in the discount zone, long trades are higher probability
Sequential Order Flow
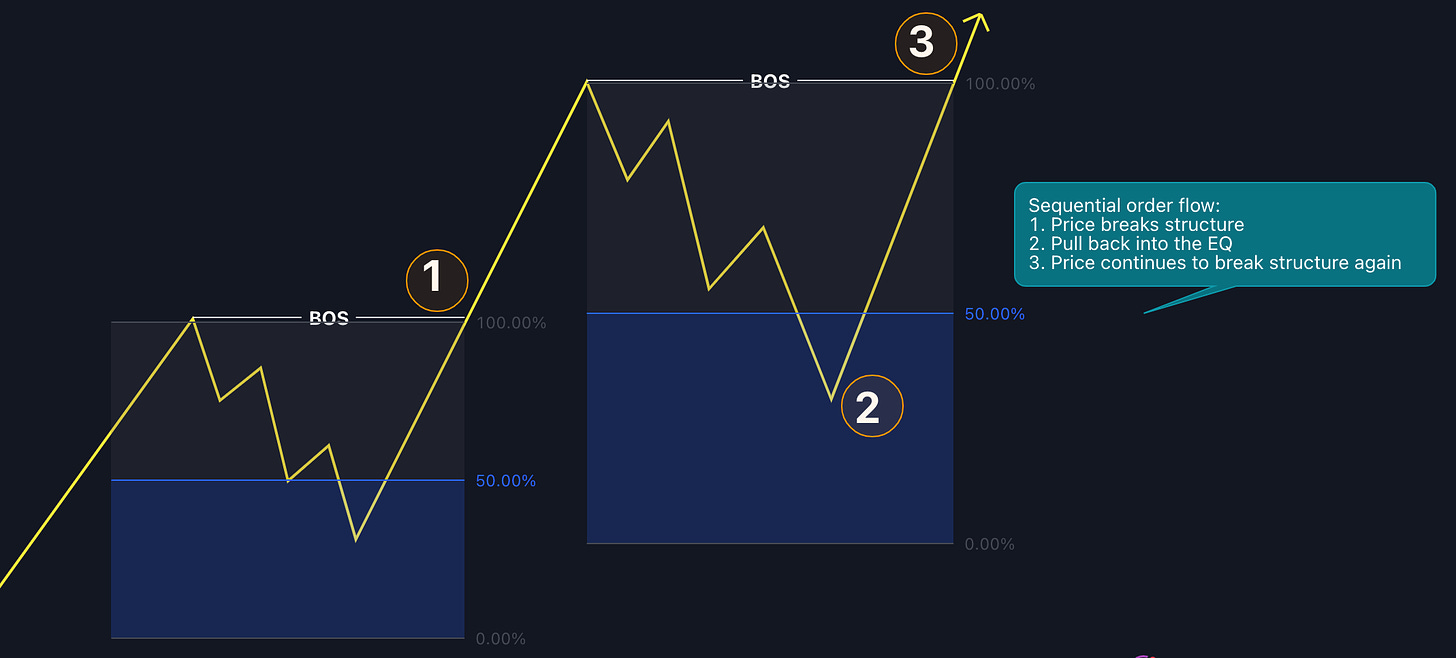
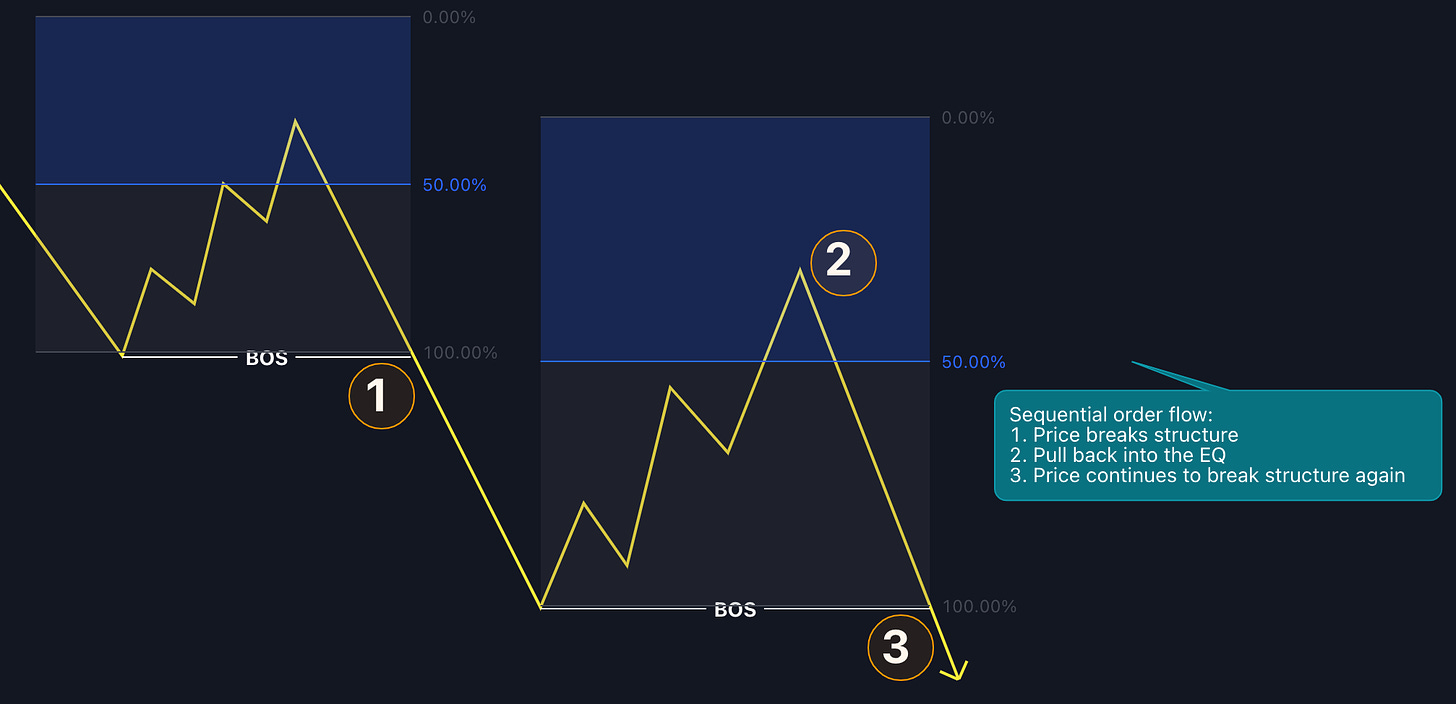
There is a specific sequence of events that I look for when I’m tracking price action/ order flow:
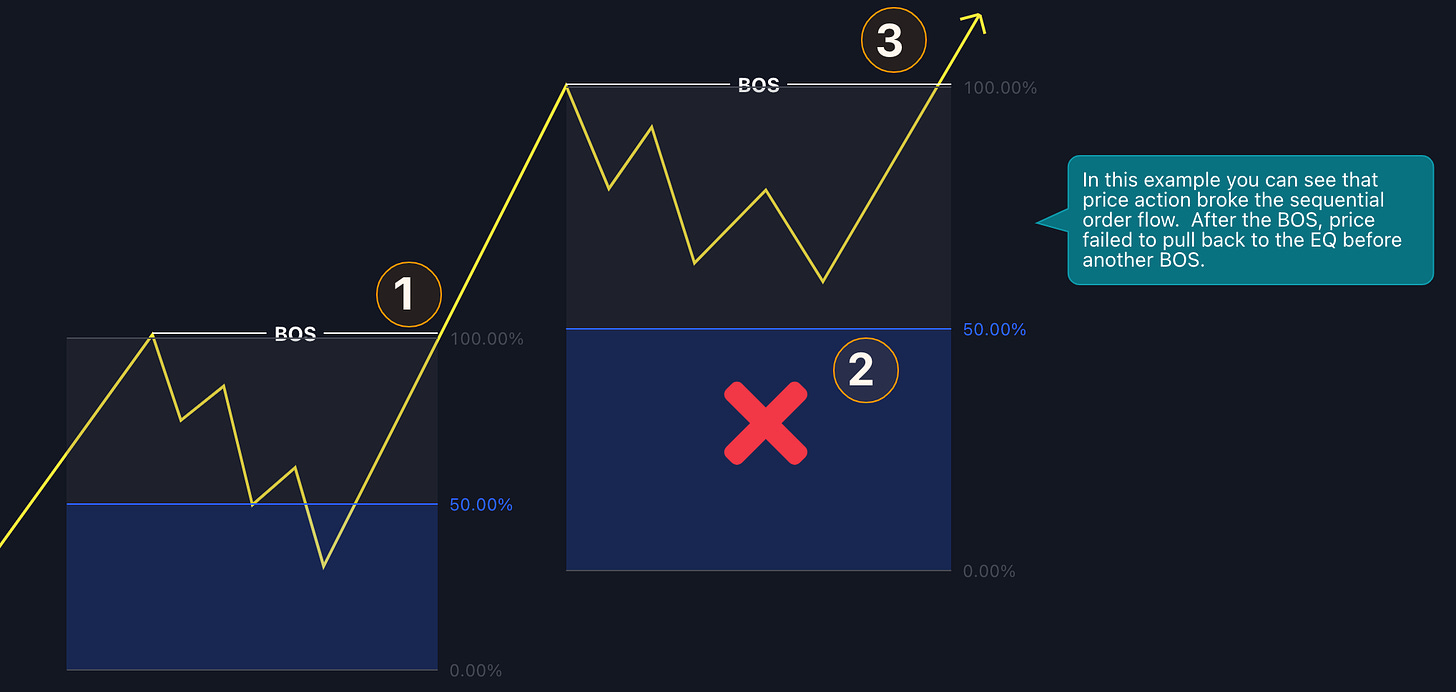
First, I want to see a break of structure
Second, I want to see price “pull back” into the EQ (50% fib)
Last, I want to see price continue to break structure
Repeat
I expect price to follow this sequence until the trend breaks.
Price Manipulation & Market Makers
The next thing you want to understand is that there will be occasions where price does not follow this sequential order flow. This is important.
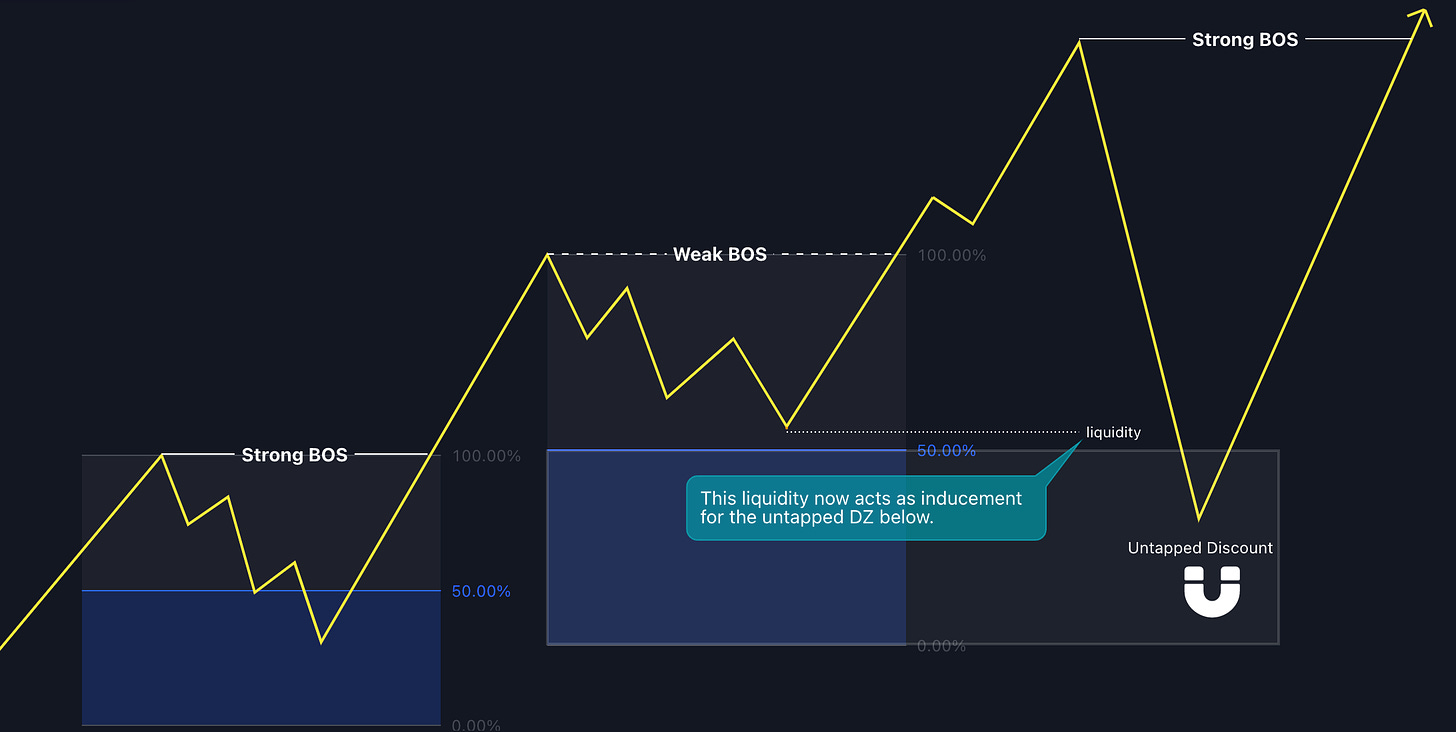
Let me show you an example of what this looks like:
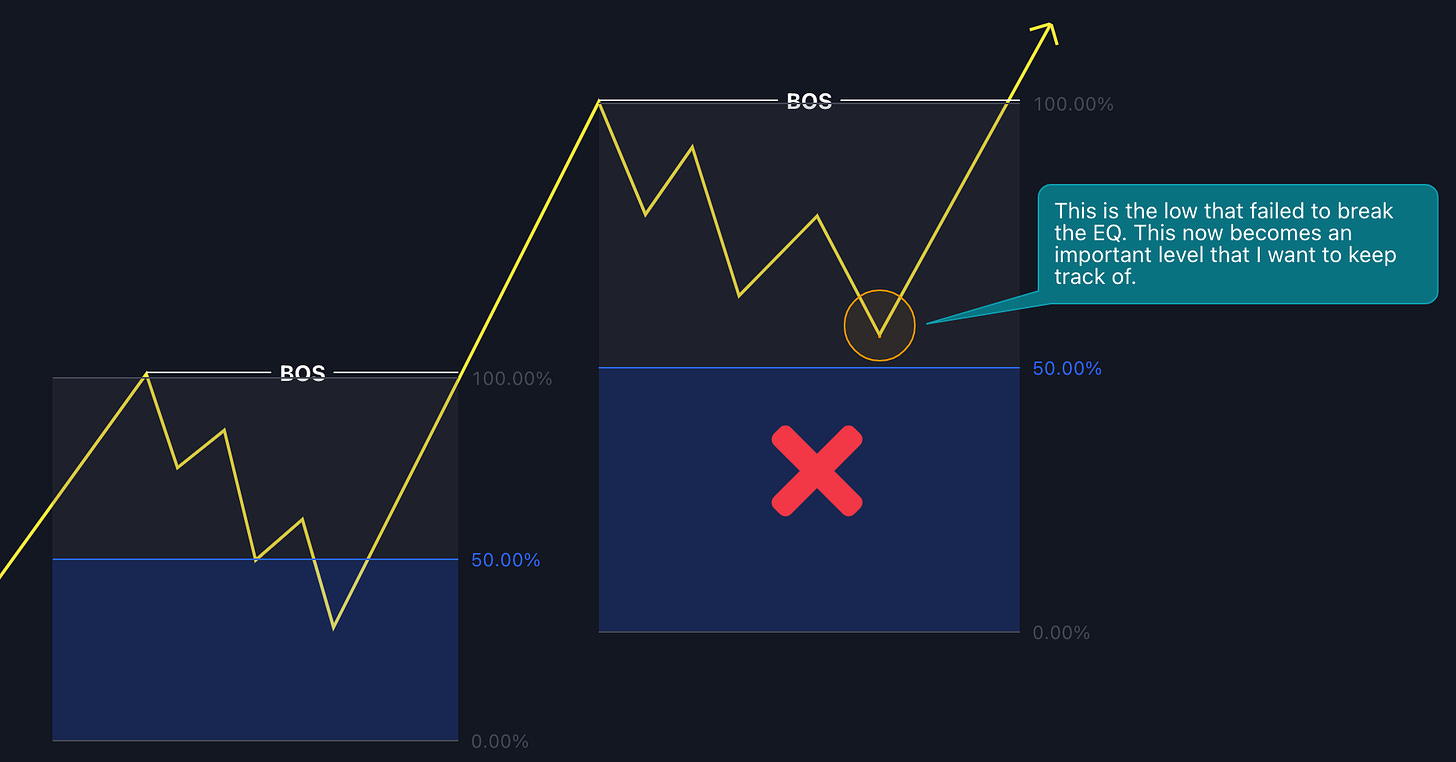
Whenever price breaks the sequential order flow, I will highlight the high/ low that failed to break the EQ for future reference.
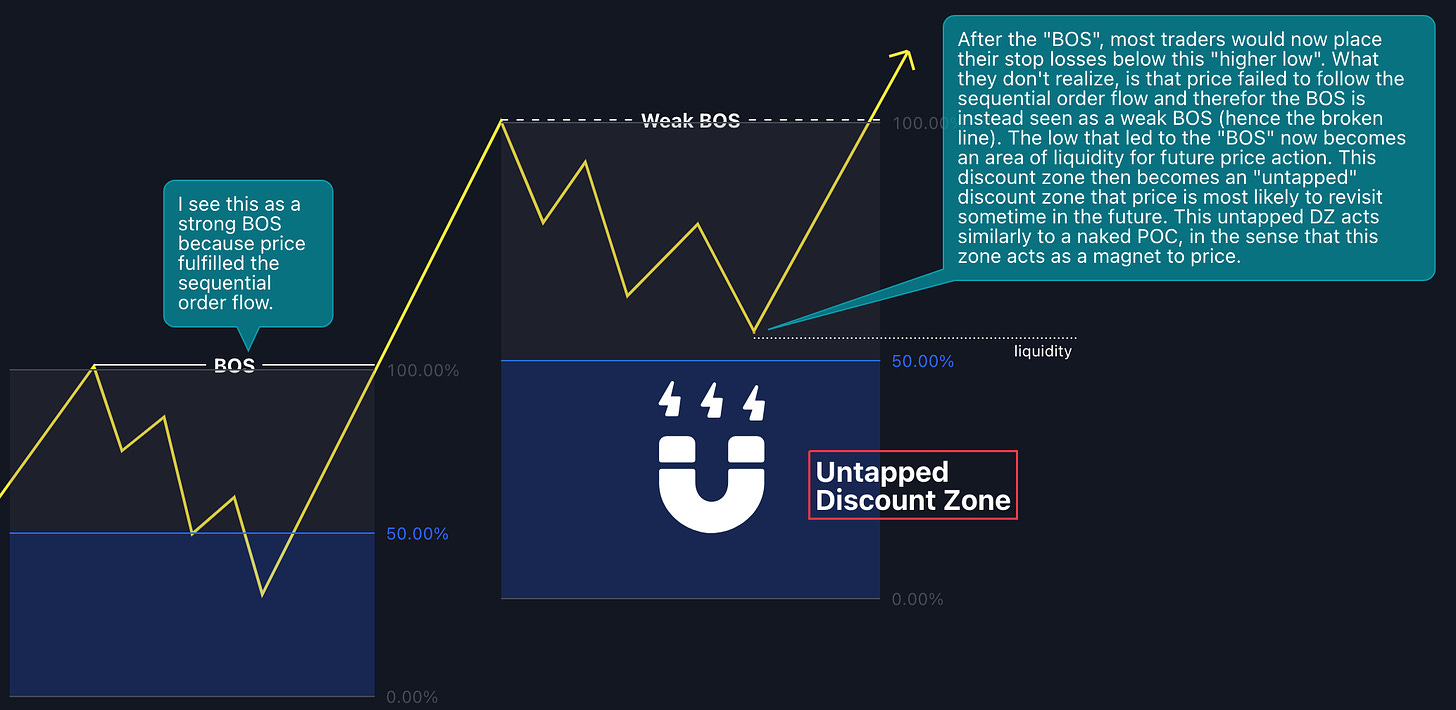
Whenever price breaks the sequential order flow, you can view this as price manipulation. Price manipulation is when market makers engineer price action patterns on the chart in order to induce traders into the market, thus engineering liquidity.
Weak BOS vs. Strong BOS
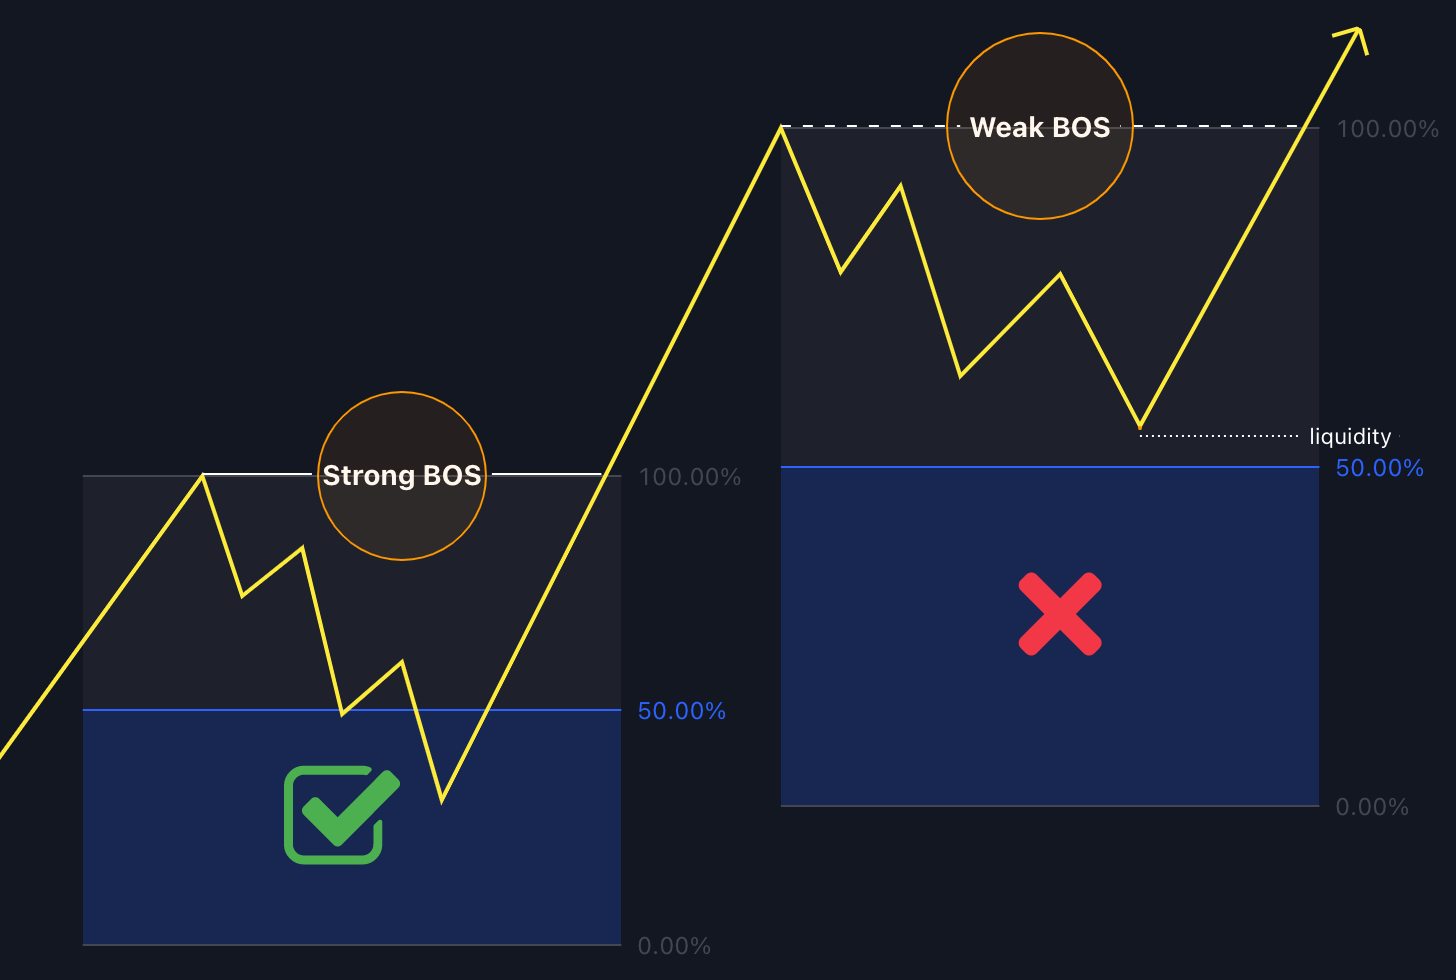
A weak break of structure is defined as a break of structure that failed to break the EQ, thus breaking the sequential order flow. A strong break of structure is a break of structure that followed the sequential order flow and successfully broke the EQ.
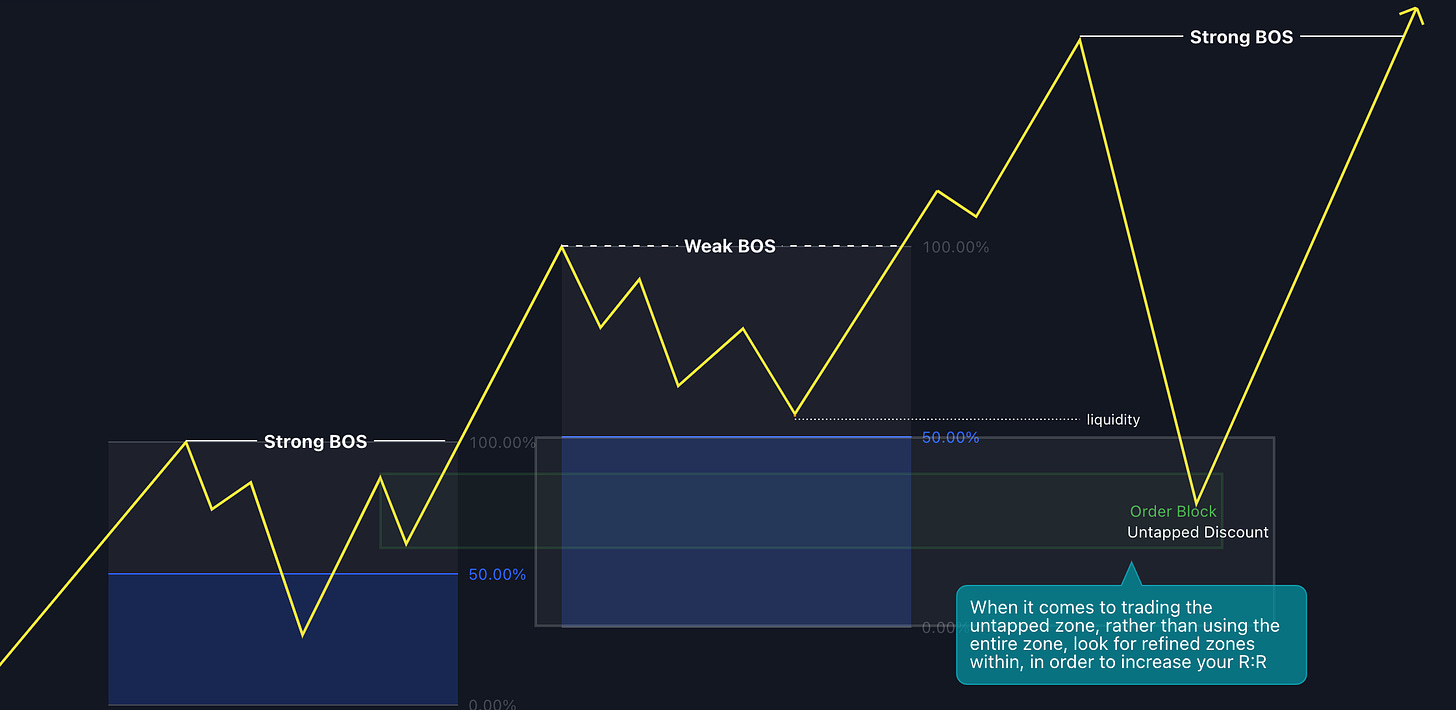
A weak break of structure can be used to identify and area of “unfinished business”, aka, an untapped premium or discount zone.
By applying these rules to your charts, you can identify what the bigger players within the market are trying to do and where they expect price to go.
Coming up, in the video tutorial, I will be going over exactly how I use the premium and discount tool in order to find a strong break of structure vs a weak break of structure and how this all ties into market liquidity and price manipulation.
If you enjoy my content, please leave me a like and a comment, and share your favorite post on social media.
Thank you all for your support.
Until next time!
Mr. E


