

Mechanical Market Structure
Mechanical Market Structure
The Complete How-To Guide

Before I get started, I’m excited to announce the premium subscription to my newsletter.
The goal of this newsletter is to share my experiences as a trader in the hopes of helping other traders who are on the same journey towards financial freedom.
For that reason, every article within my newsletter will always be free to all subscribers, however if you’re interested in a premium subscription, I will be releasing video tutorials to accompany each post where I can delve into grater detail on the topics of discussion.
To gain access to the Mechanical Market Structure video tutorial, click here.
And now, without further ado..
Mechanical Market Structure
Market structure is the secret sauce when it comes to trading. In this article, I’m going to share the following:
How I view market structure
The rules I use to map market structure correctly
How to accurately predict where price is likely to go next
A simple market structure-based trading strategy you can start using today
What is Market Structure?
To understand market structure, we must first understand Price Action.
Price action is the ebb and flow of an asset’s price over a period of time. This constant fluctuation of price is made up of a series of impulses and corrections as seen below.
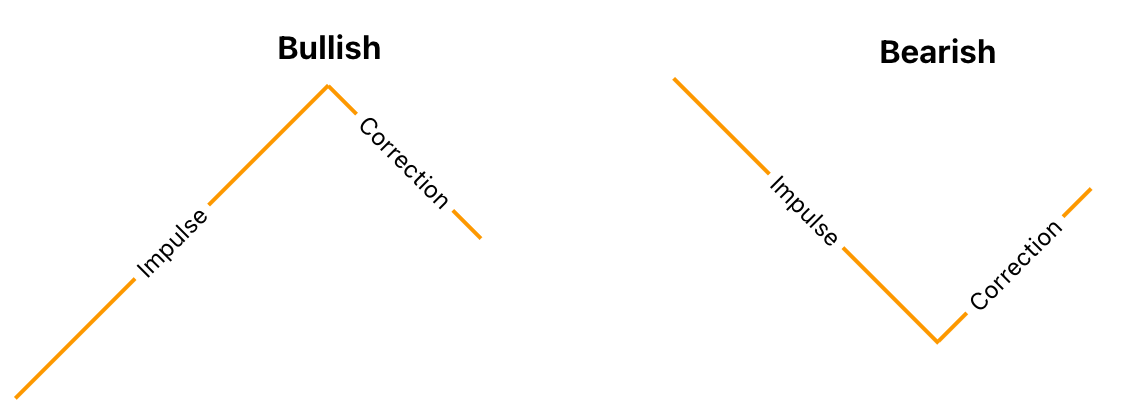
These impulses and corrections can be further organized into trends, eg. uptrends and downtrends.
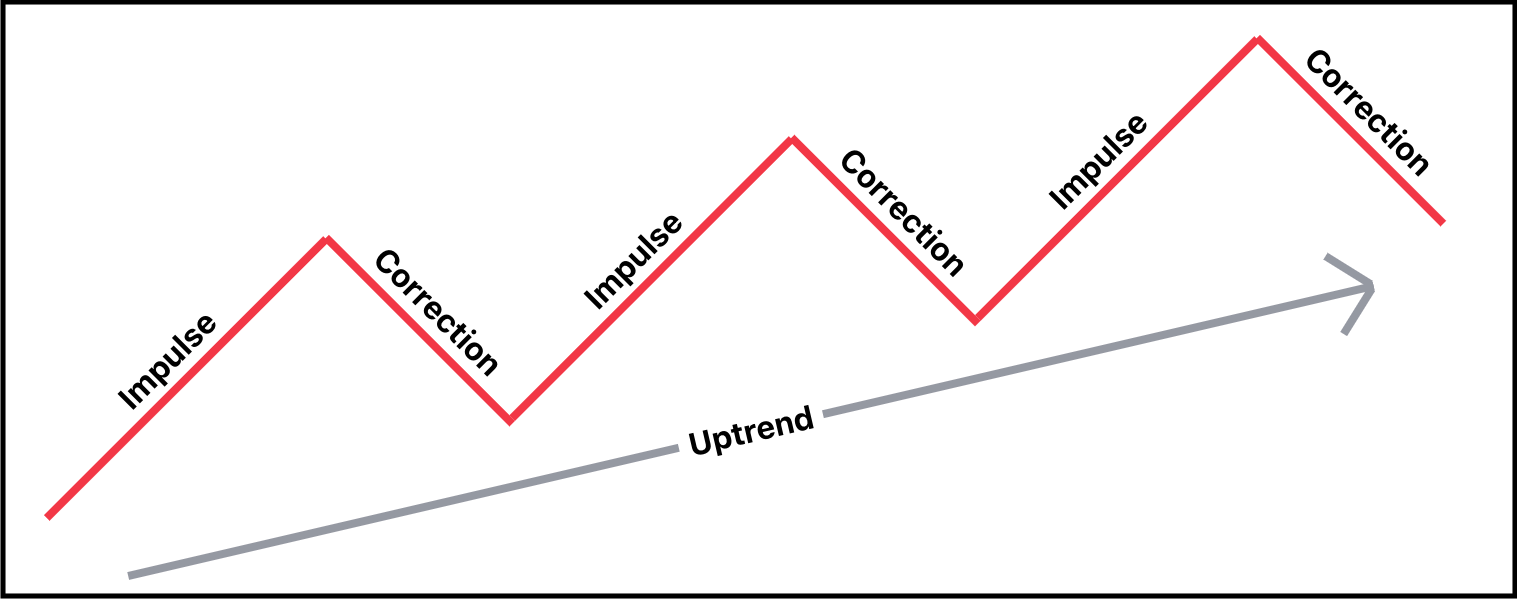
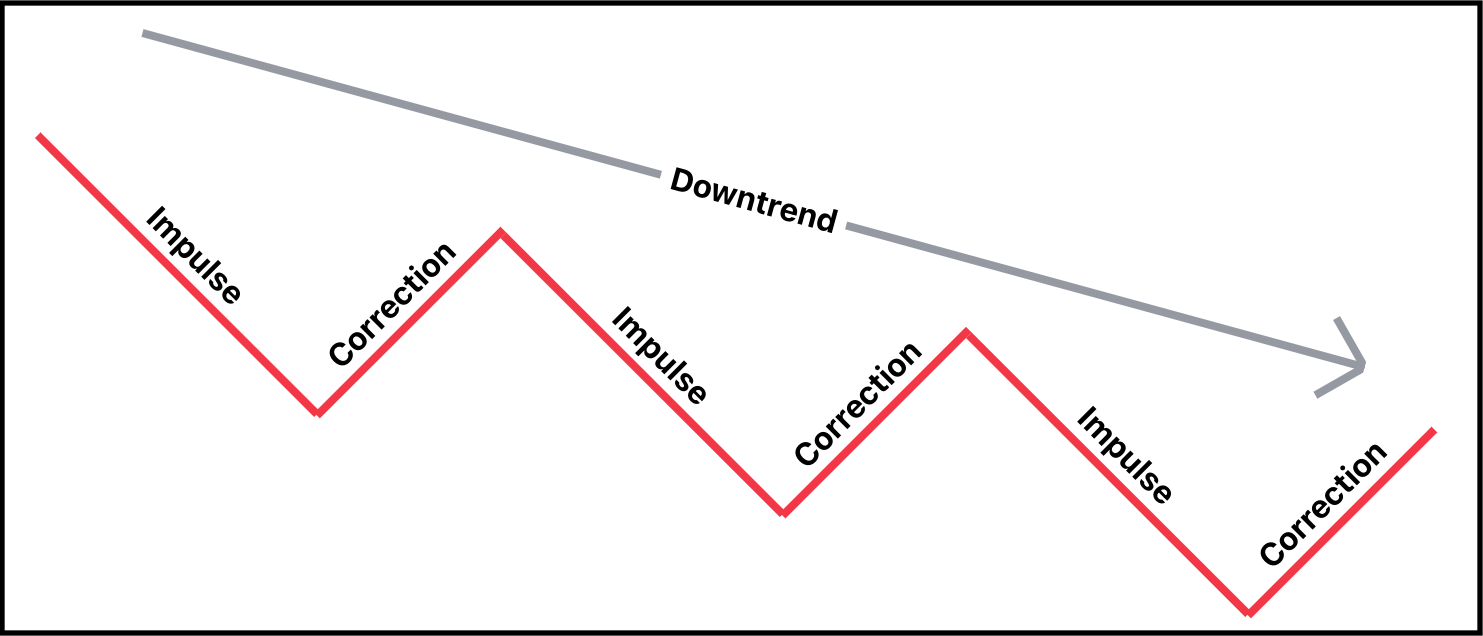
Furthermore, trends can be organized into what we call market structure.
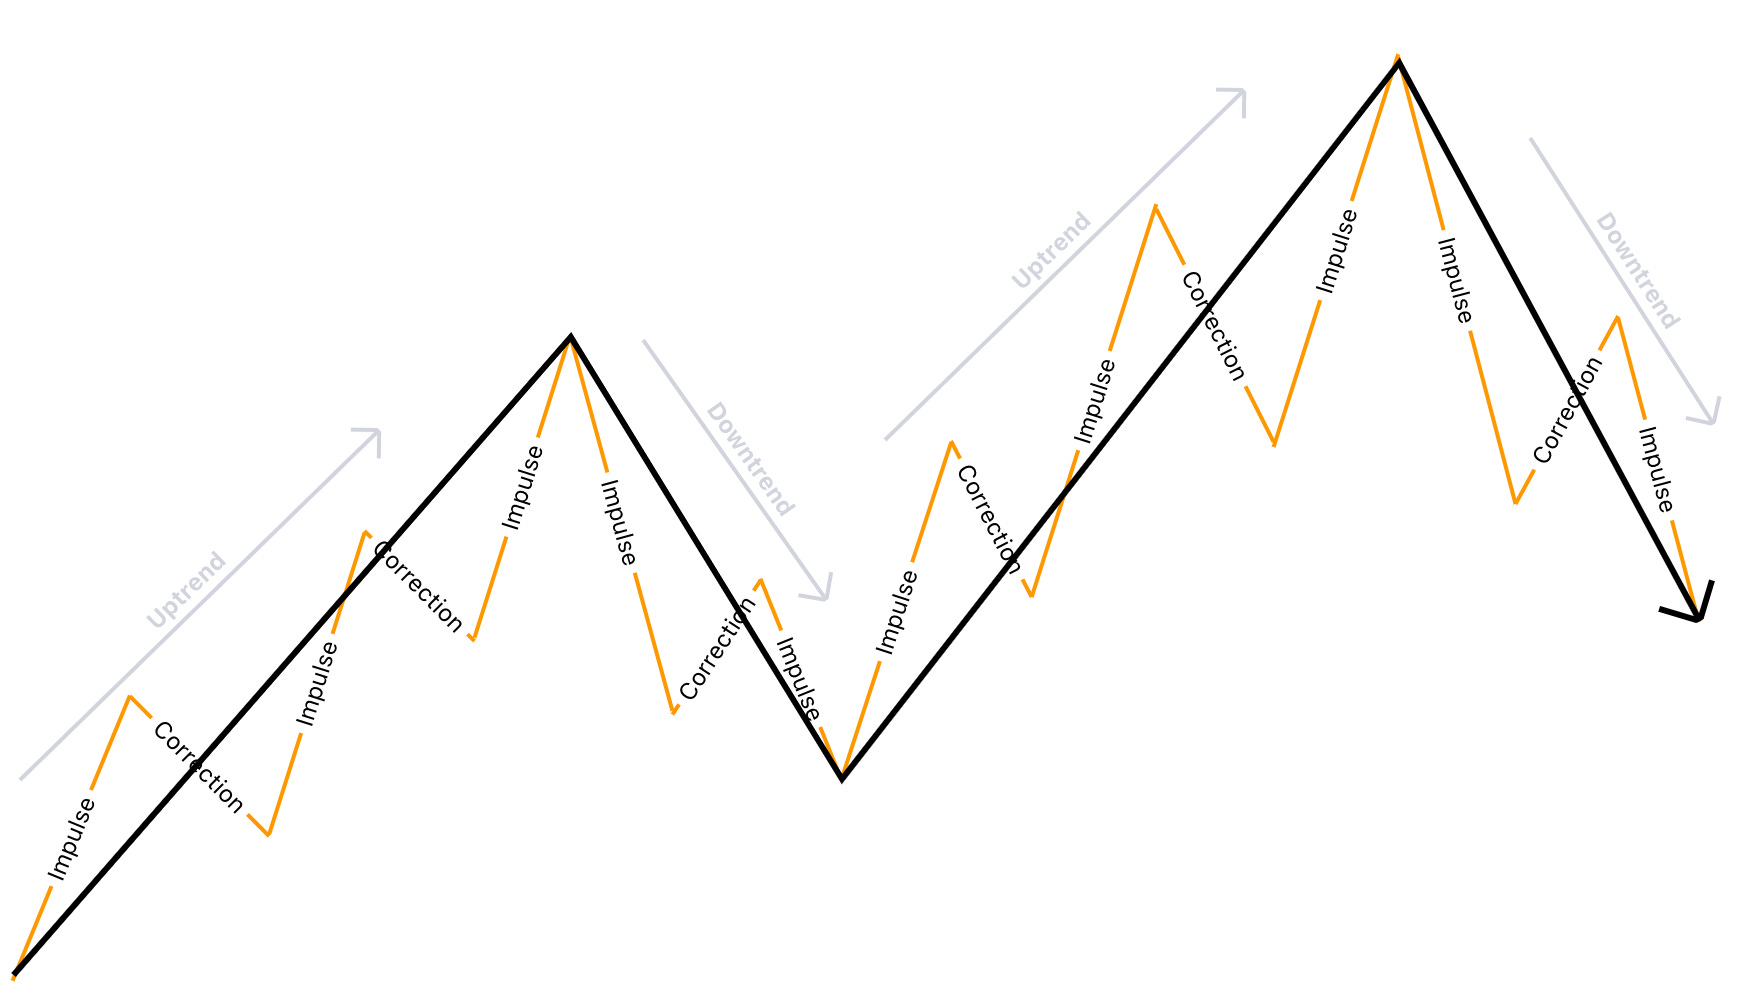
Understanding market structure is how we can begin to accurately predict where price is more likely to go next.
When it comes to mapping market structure, you need a systematic method that you can repeat across any market, any asset, and any time frame.
Before we get into how to start mapping market structure — I want you to memorize something.
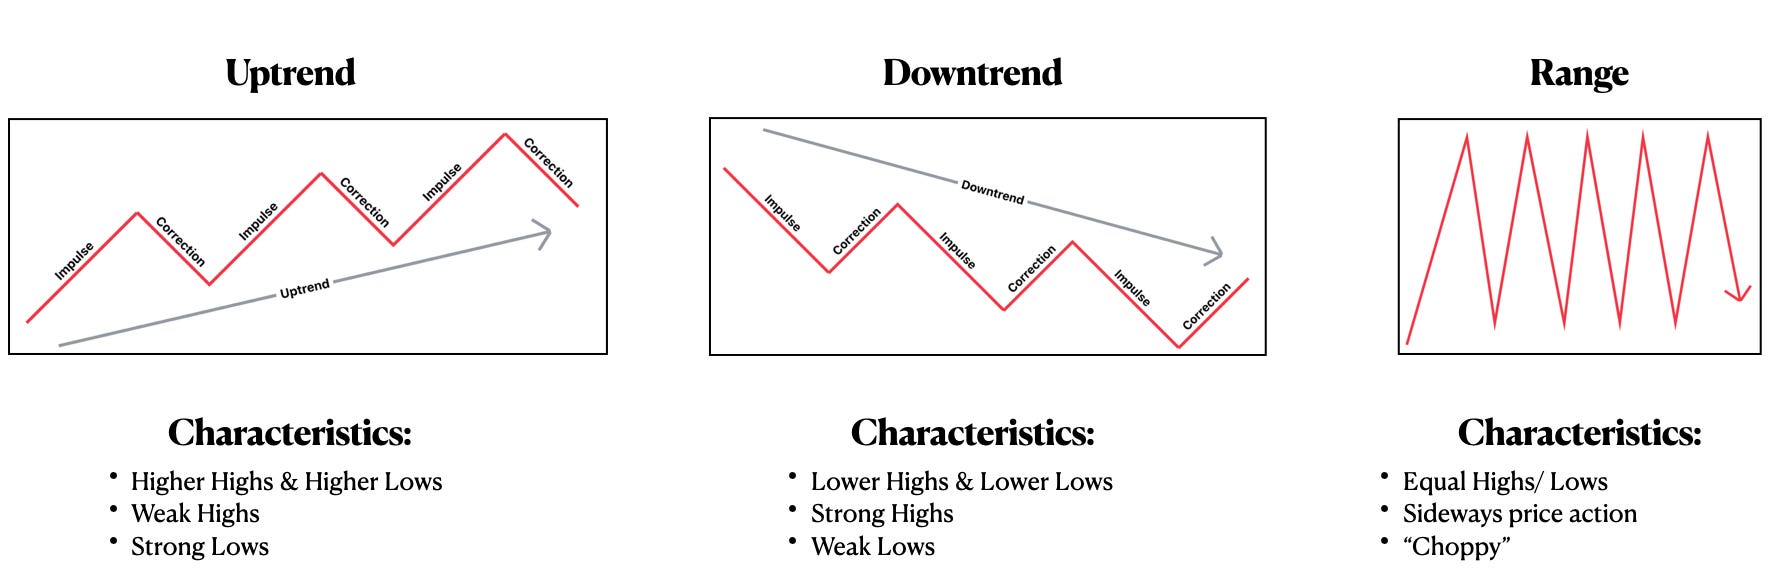
Market structure can move in three directions and each has a unique set of characteristics that I want you to write down, print out, or do whatever you have to do to memorize, because this will come up again later:
Mapping Market Structure
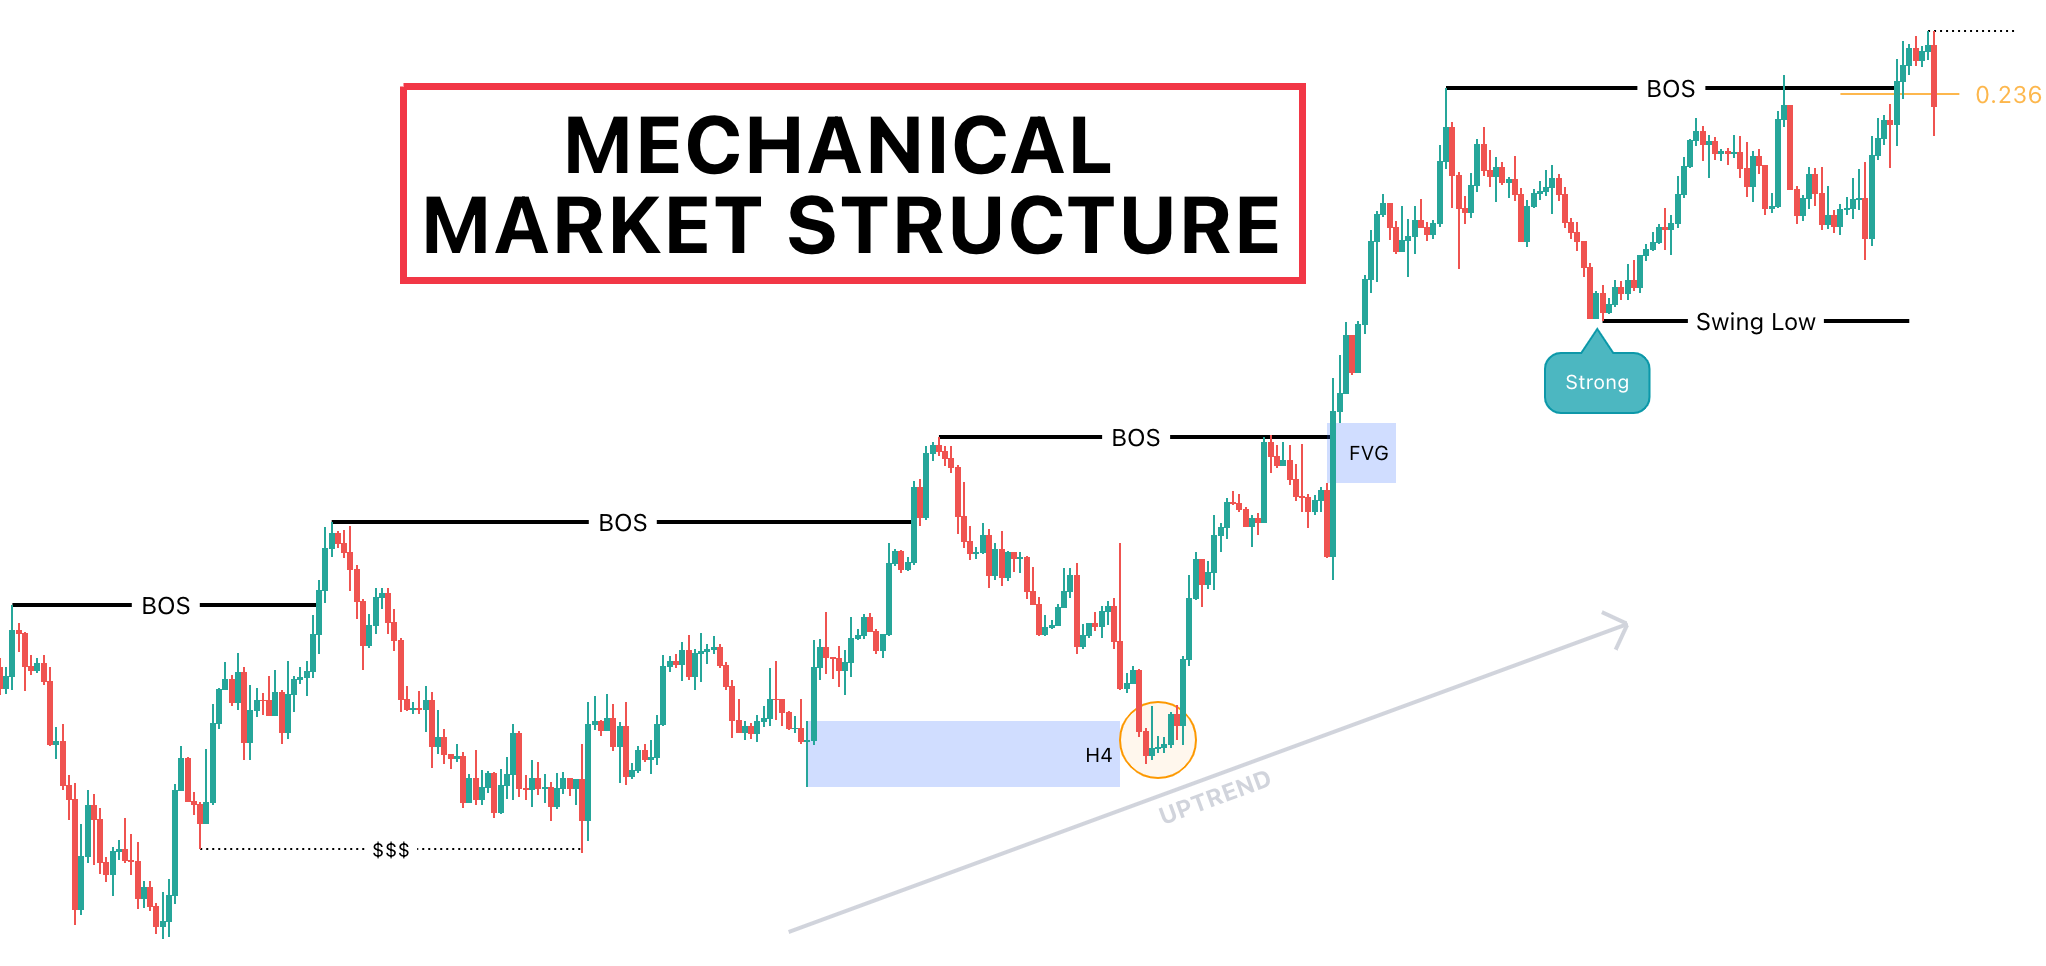
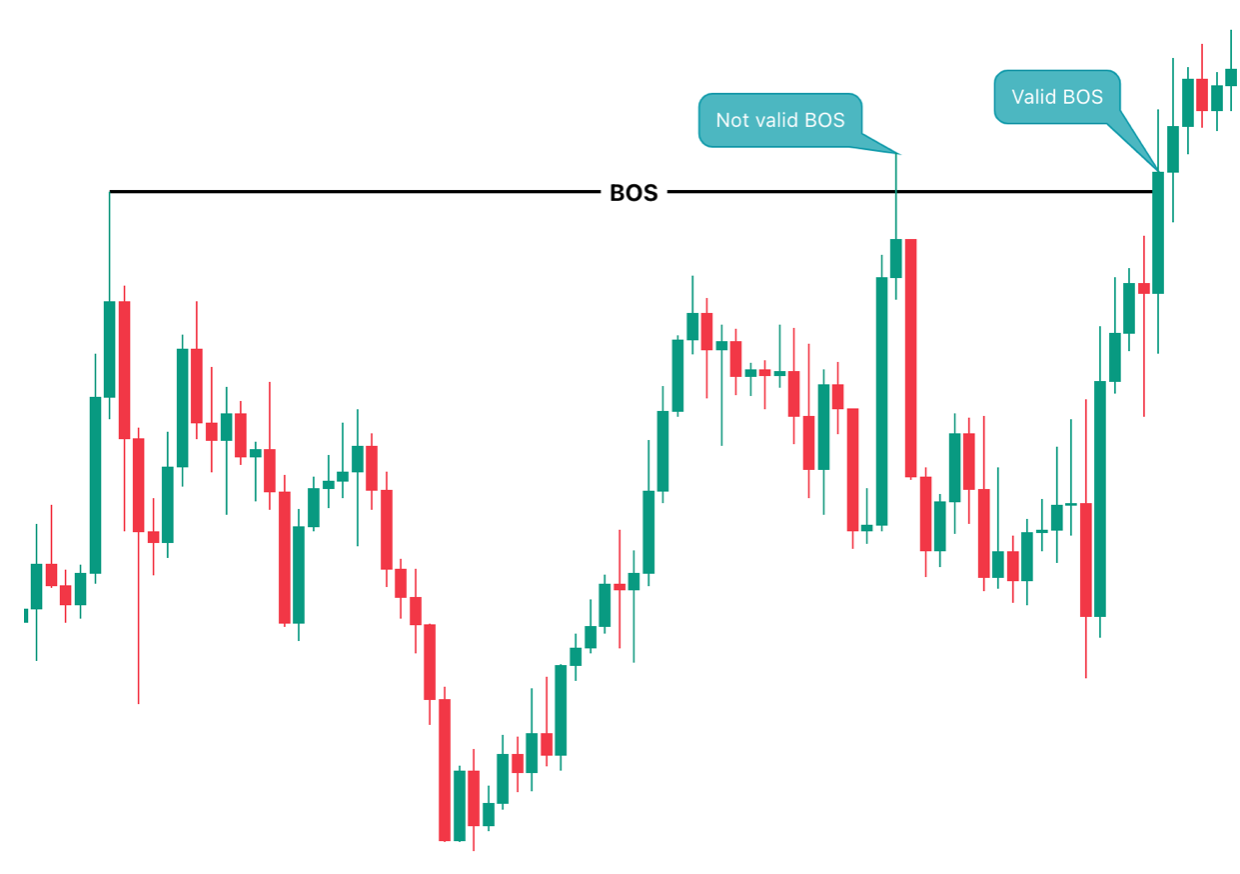
The first thing you need to do in mapping market structure is to identify a valid break of structure (BOS).
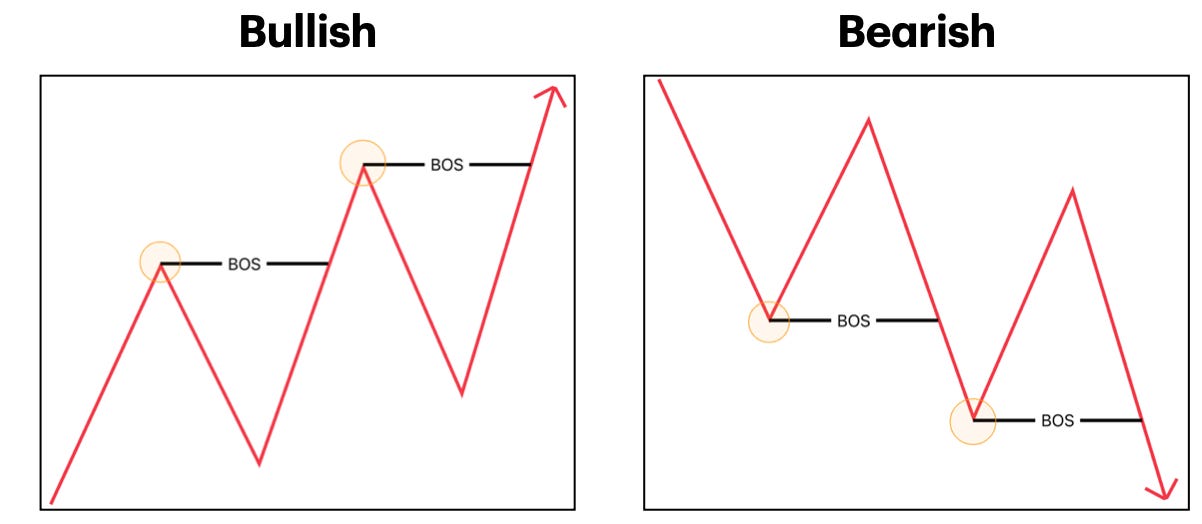
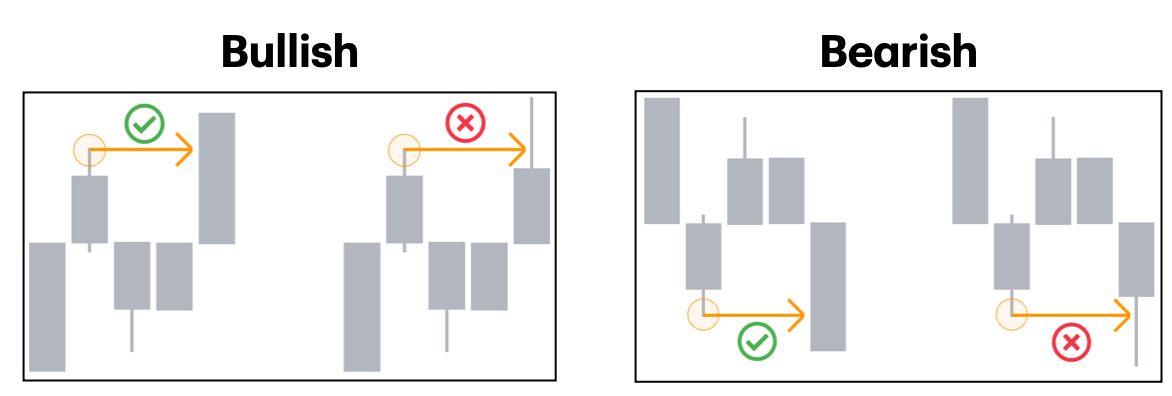
Start by looking for areas on the chart where price left behind a significant high or low, usually after an impulsive move, and look for the candle that eventually broke through this level. In order to confirm a valid break of structure I want to see a candle body that fully closes through the level — a wick is not enough.
Here is what I want to see in order to confirm a valid break of structure:
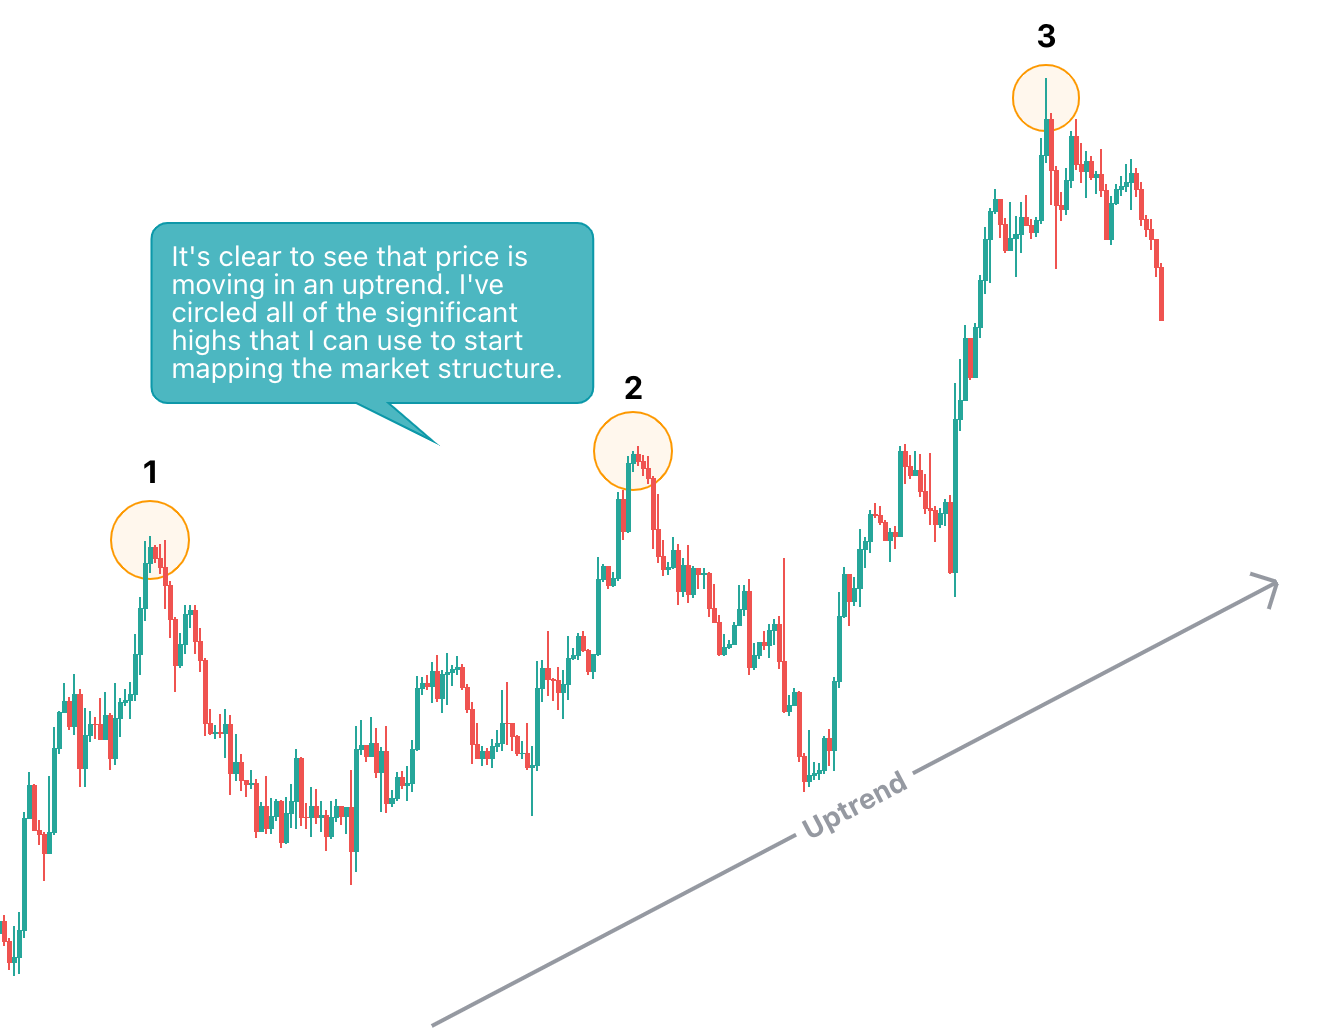
When price is in an uptrend, start by looking for a valid BOS of a previous significant high.
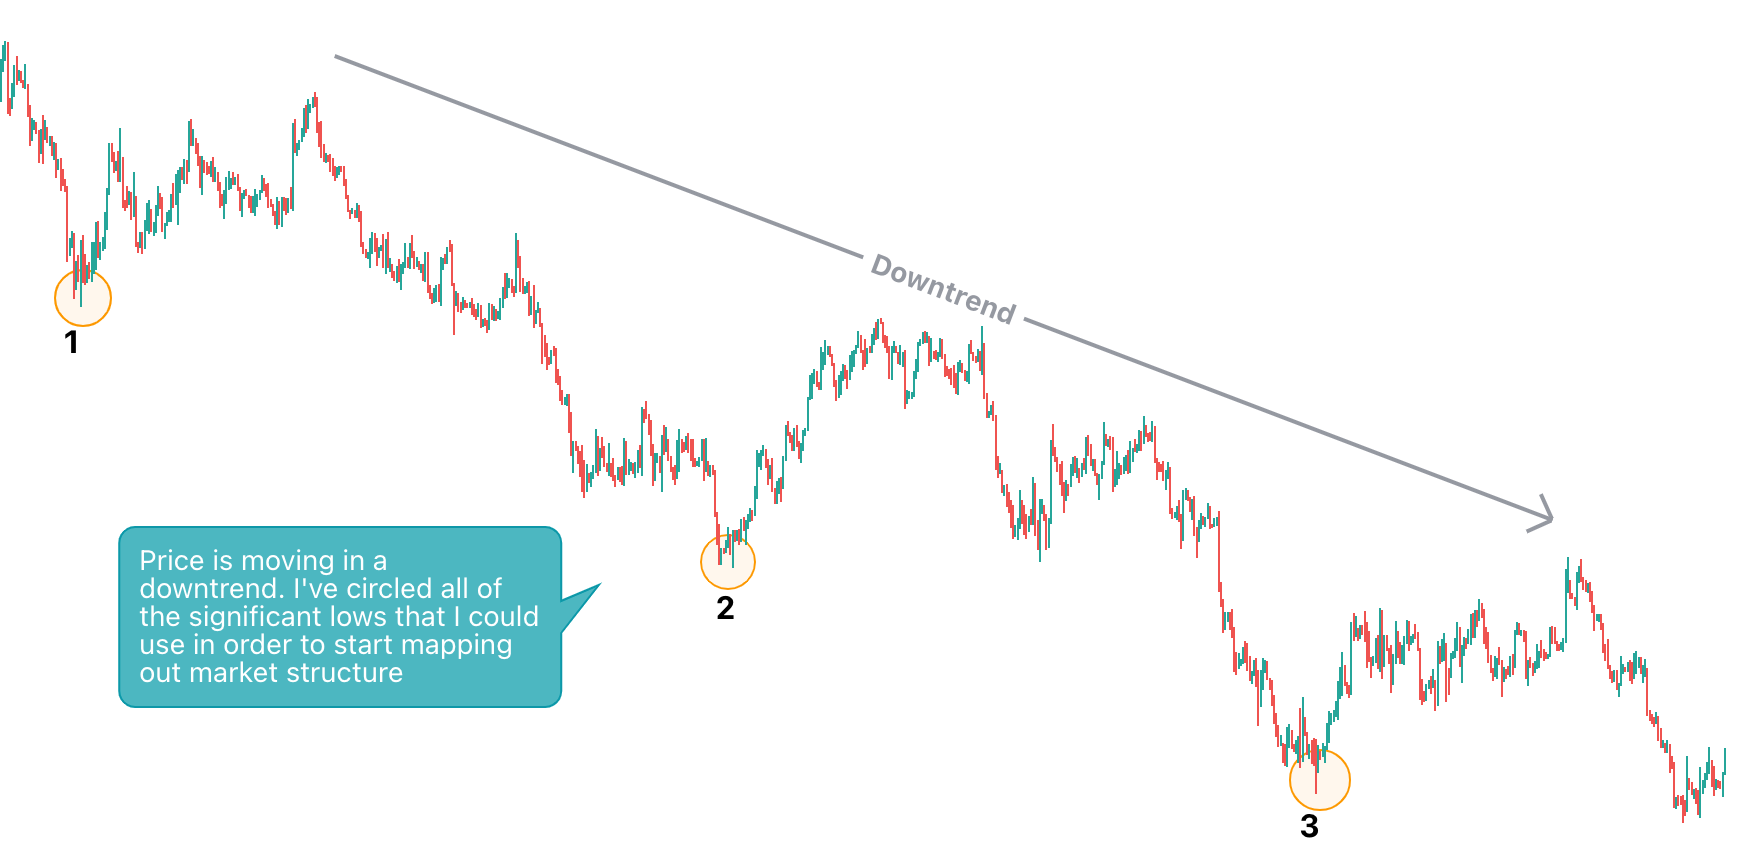
When price is in a downtrend, start by looking for a valid BOS of a previous significant low.
I personally like to map market structure from the beginning of a trend
Once you’ve determined where you want to start mapping market structure, you can then look for the valid BOS to draw your first BOS line.
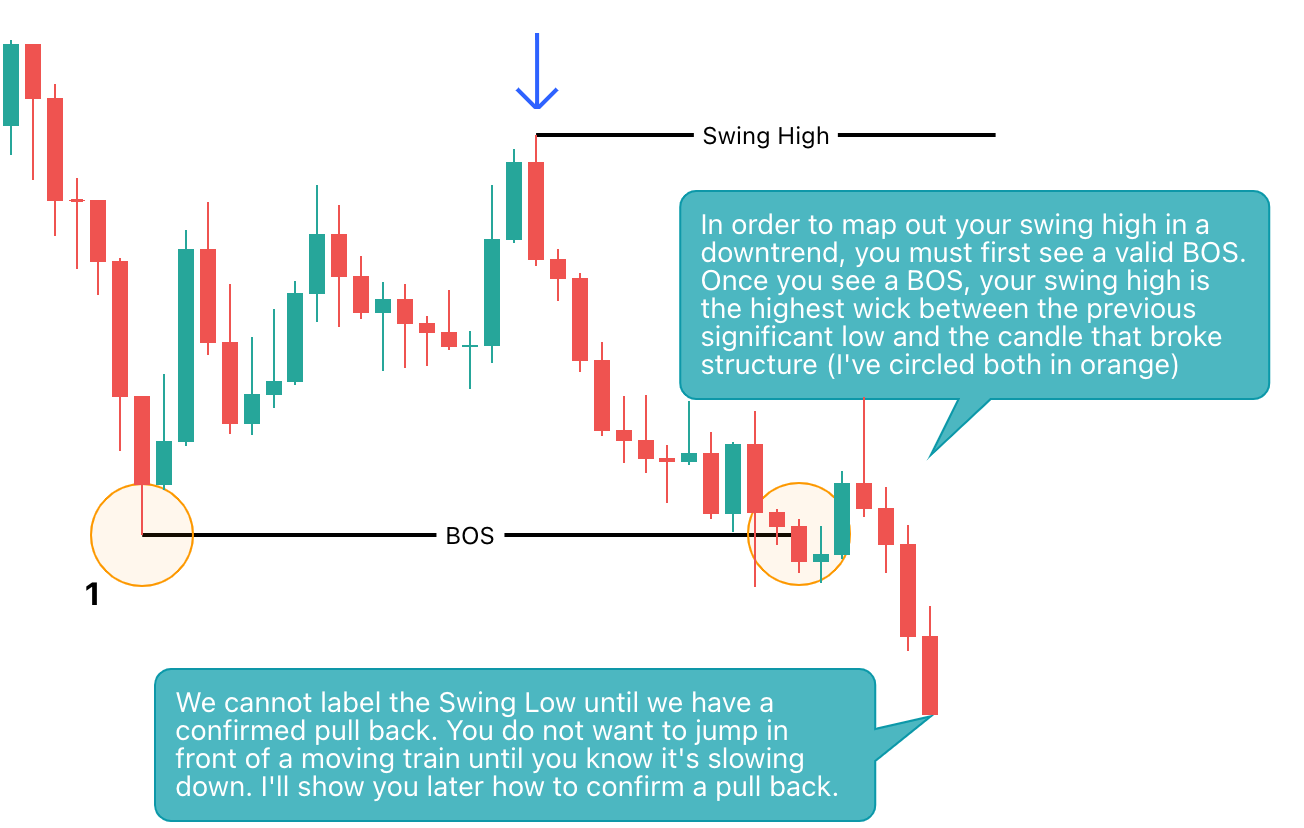
Let’s have a look at the first significant low (1) in the downtrend shown above:
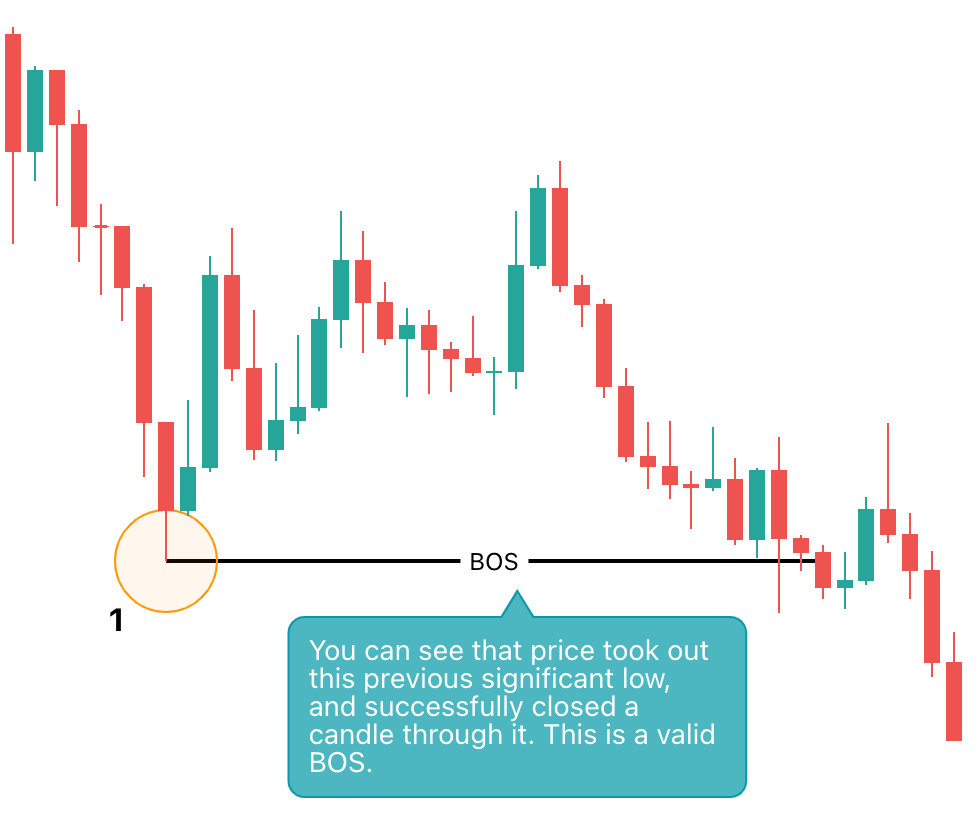
Once you confirm a valid BOS, draw your line. This is important because before you do anything else, you must first label your BOS. After you have your BOS line, you can then start mapping out your swing high and swing low.
Here are the rules I use for labeling swing highs & swing lows in correct order:
Swing Highs & Swing Lows
When price is in a downtrend:
After a BOS in a downtrend, you can then map out your Swing High
The swing high is the highest wick between the previous significant low, and the candle that broke structure.
You can only label your Swing Low once you have confirmed that price is in a pull back
When price is in an uptrend:
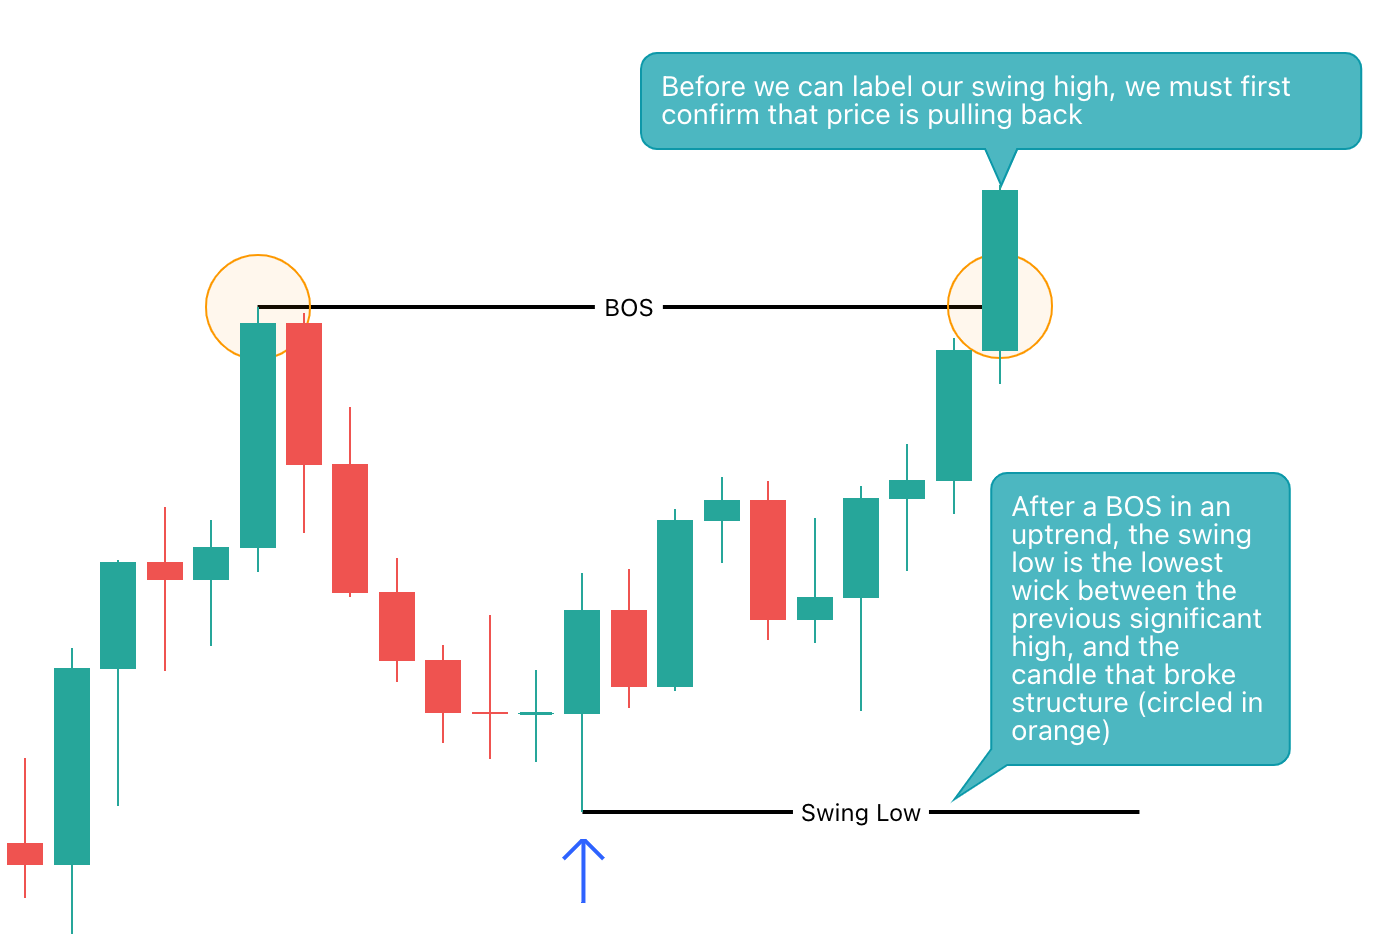
After a BOS in a uptrend, you can then map out your Swing Low
The swing low is the lowest wick between the previous significant high, and the candle that broke structure.
You can only label your Swing High once you have confirmed that price is in a pull back
In both examples shown above, it is important to notice that you can not label your last swing point until you confirm that price is pulling back after a BOS. The reason for this is because it takes a lot of orders/ strength behind a move, in order for price to break structure. The last thing you want to do is to trade against a strong impulsive move, therefore it’s crucial to be able to determine when the impulse is slowing down and when the pull back has officially started.
How to confirm a pull back
There are 2 methods I use in order to confirm a pull back:
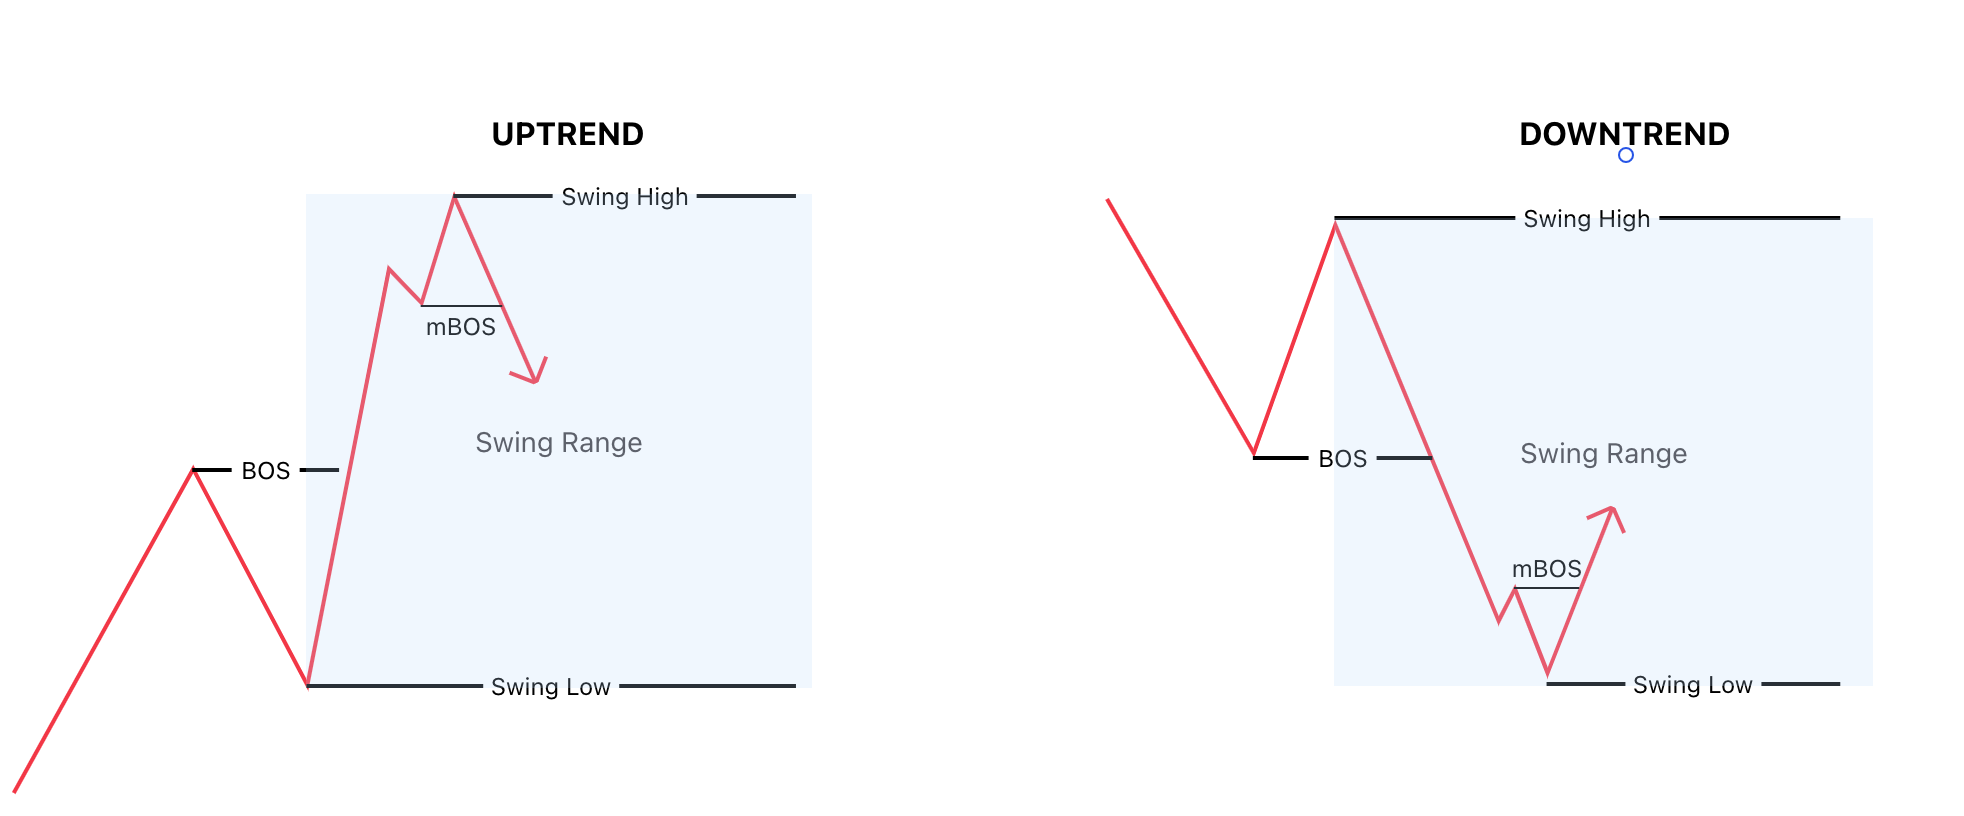
Look for a minor break of structure (mBOS)
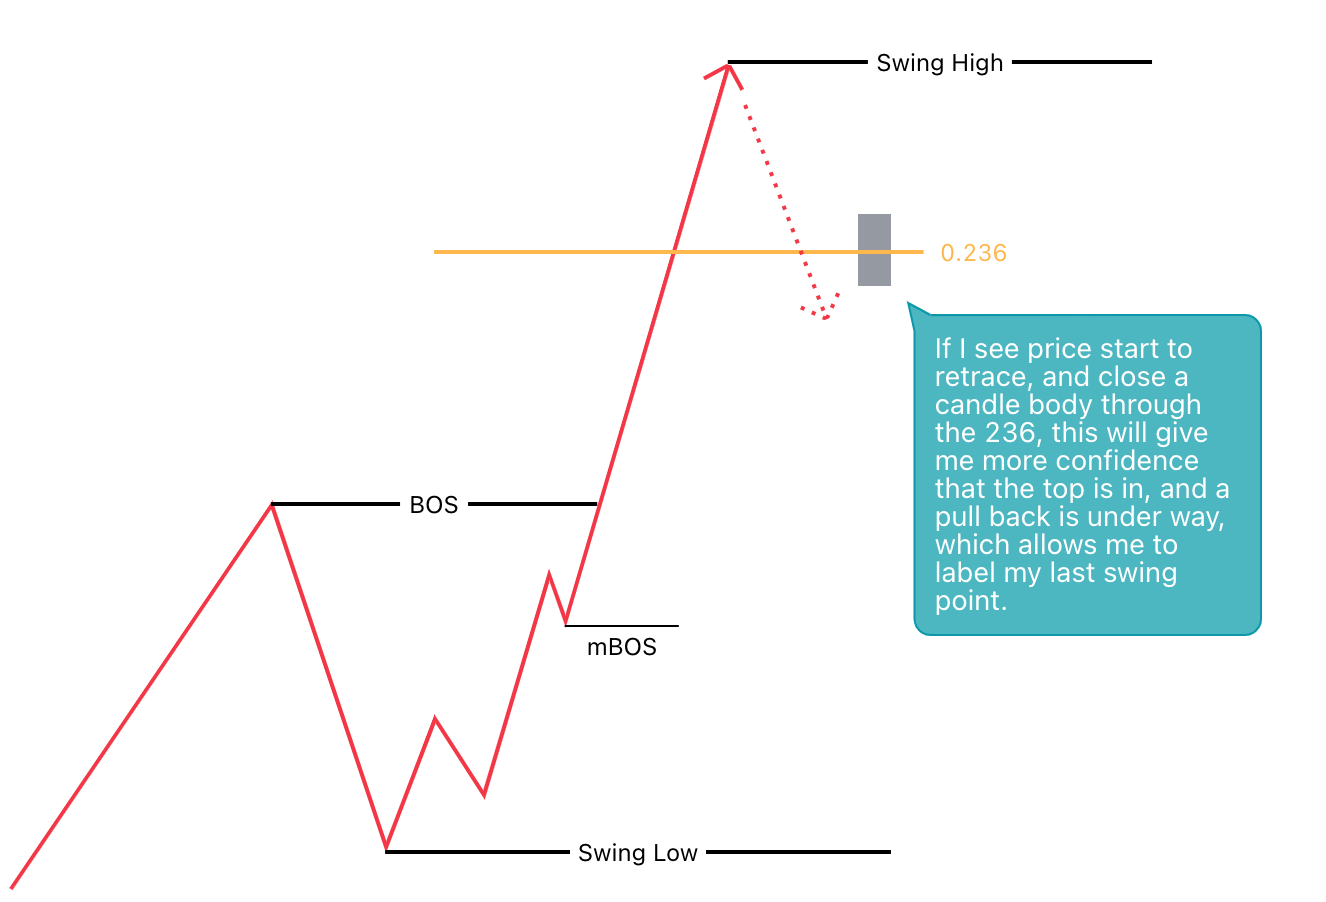
Look for a candle that closes through the 0.236 fib retracement level
The most reliable way to confirm that price is pulling back, after a BOS, is to look for a minor break of structure. Option 2 is just a “back up plan” that you use in special cases, which I will get into shortly.
First, let me show you what a minor break of structure looks like, then I will explain what minor structure is, and how to spot an mBOS.
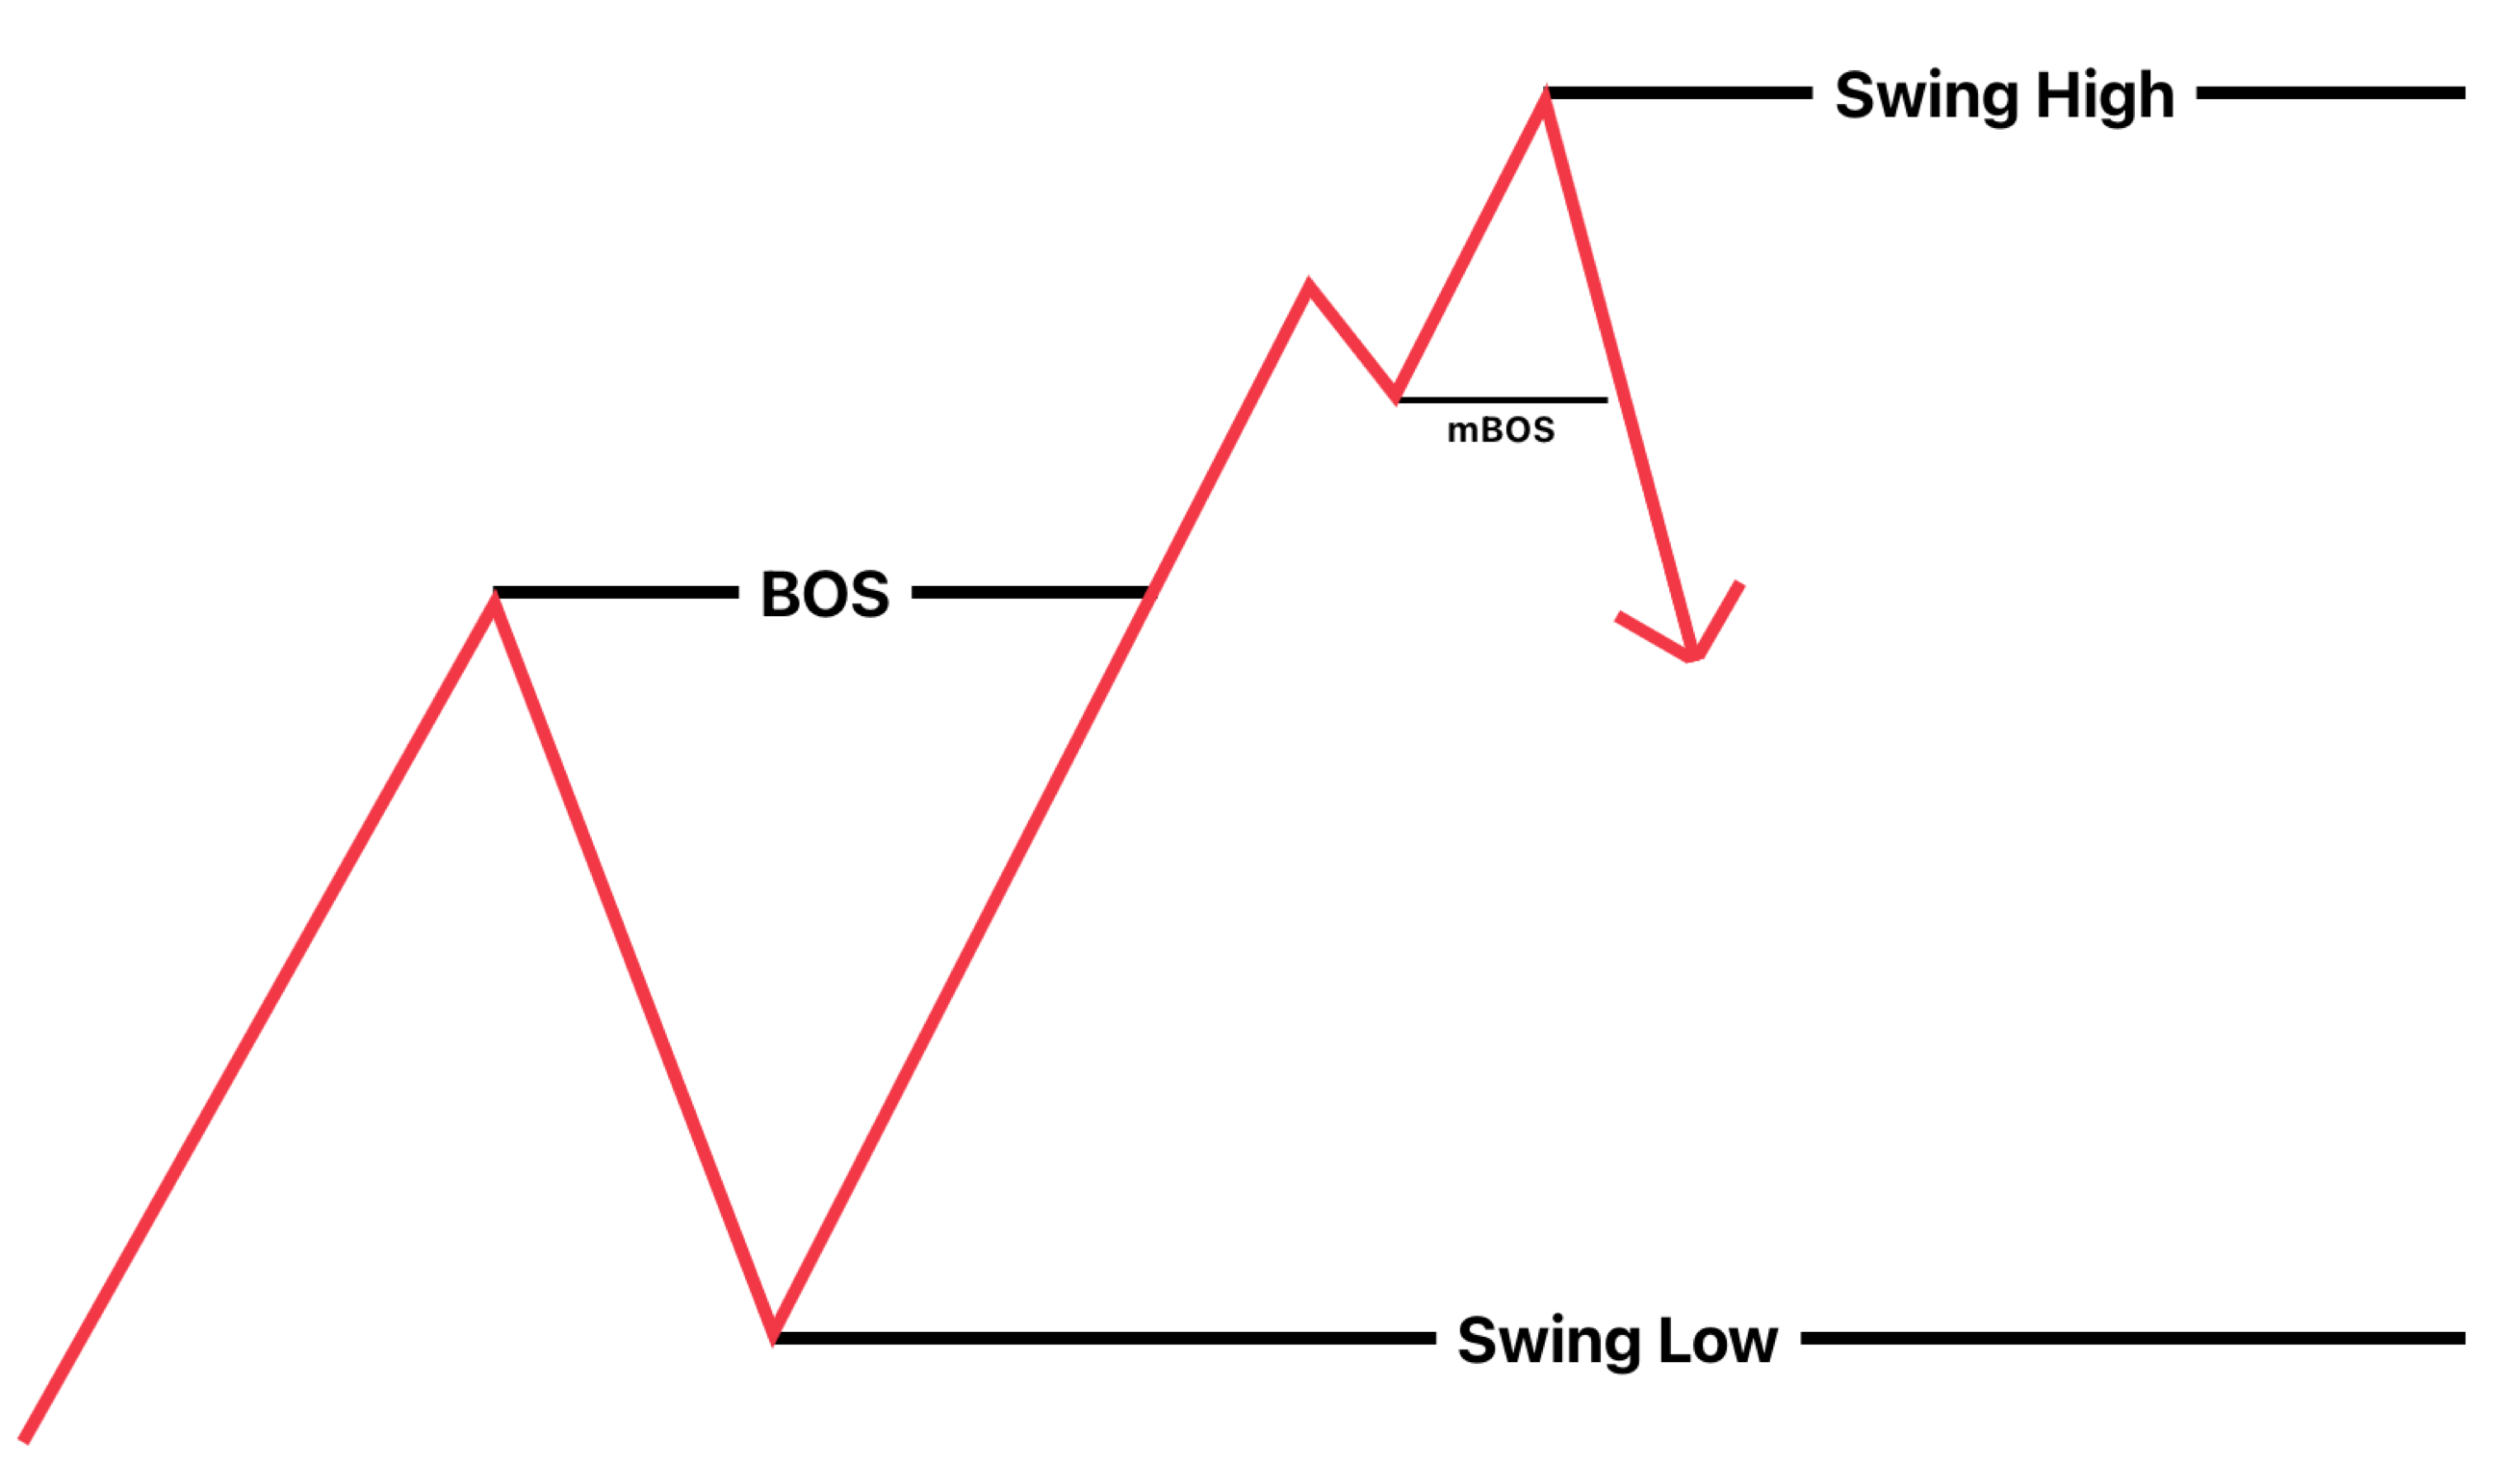
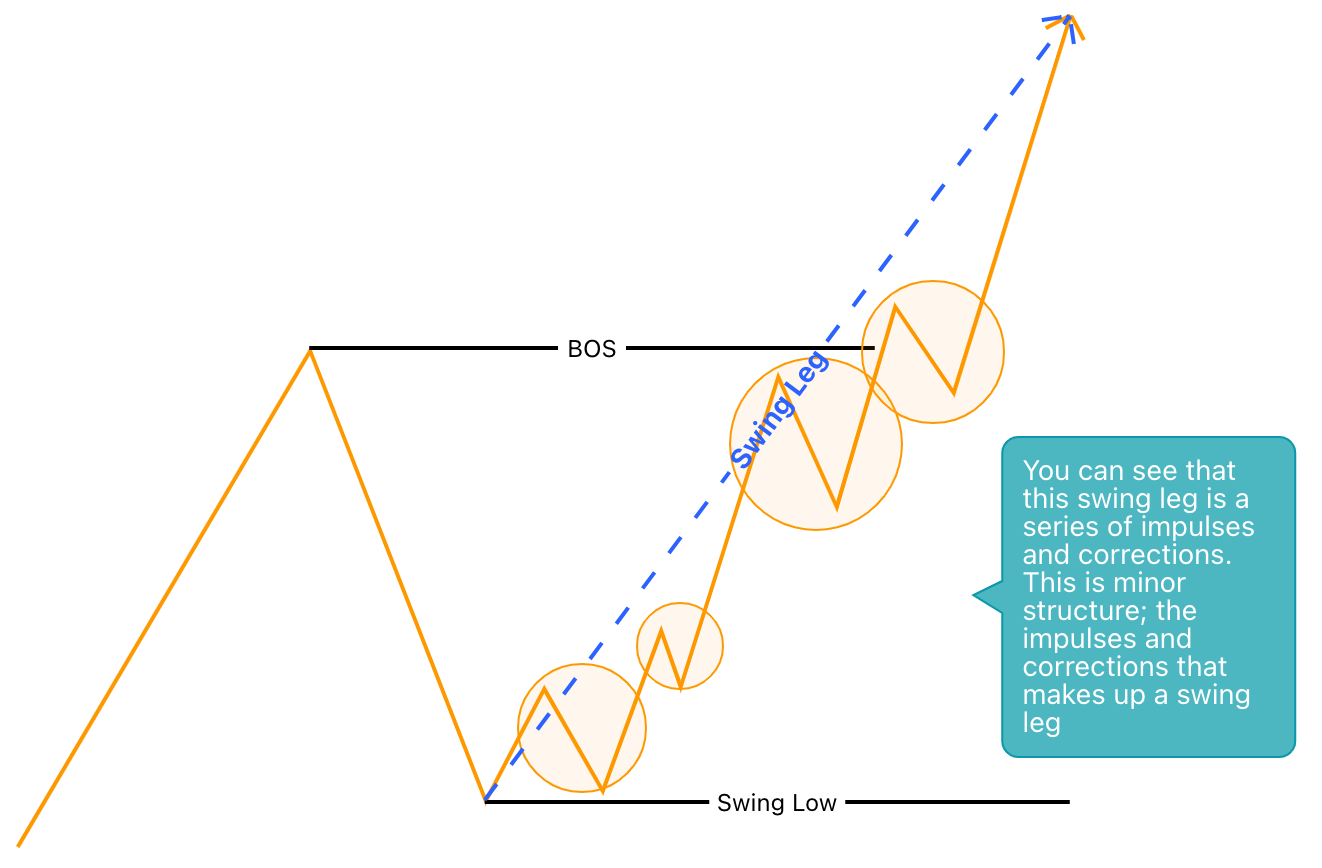
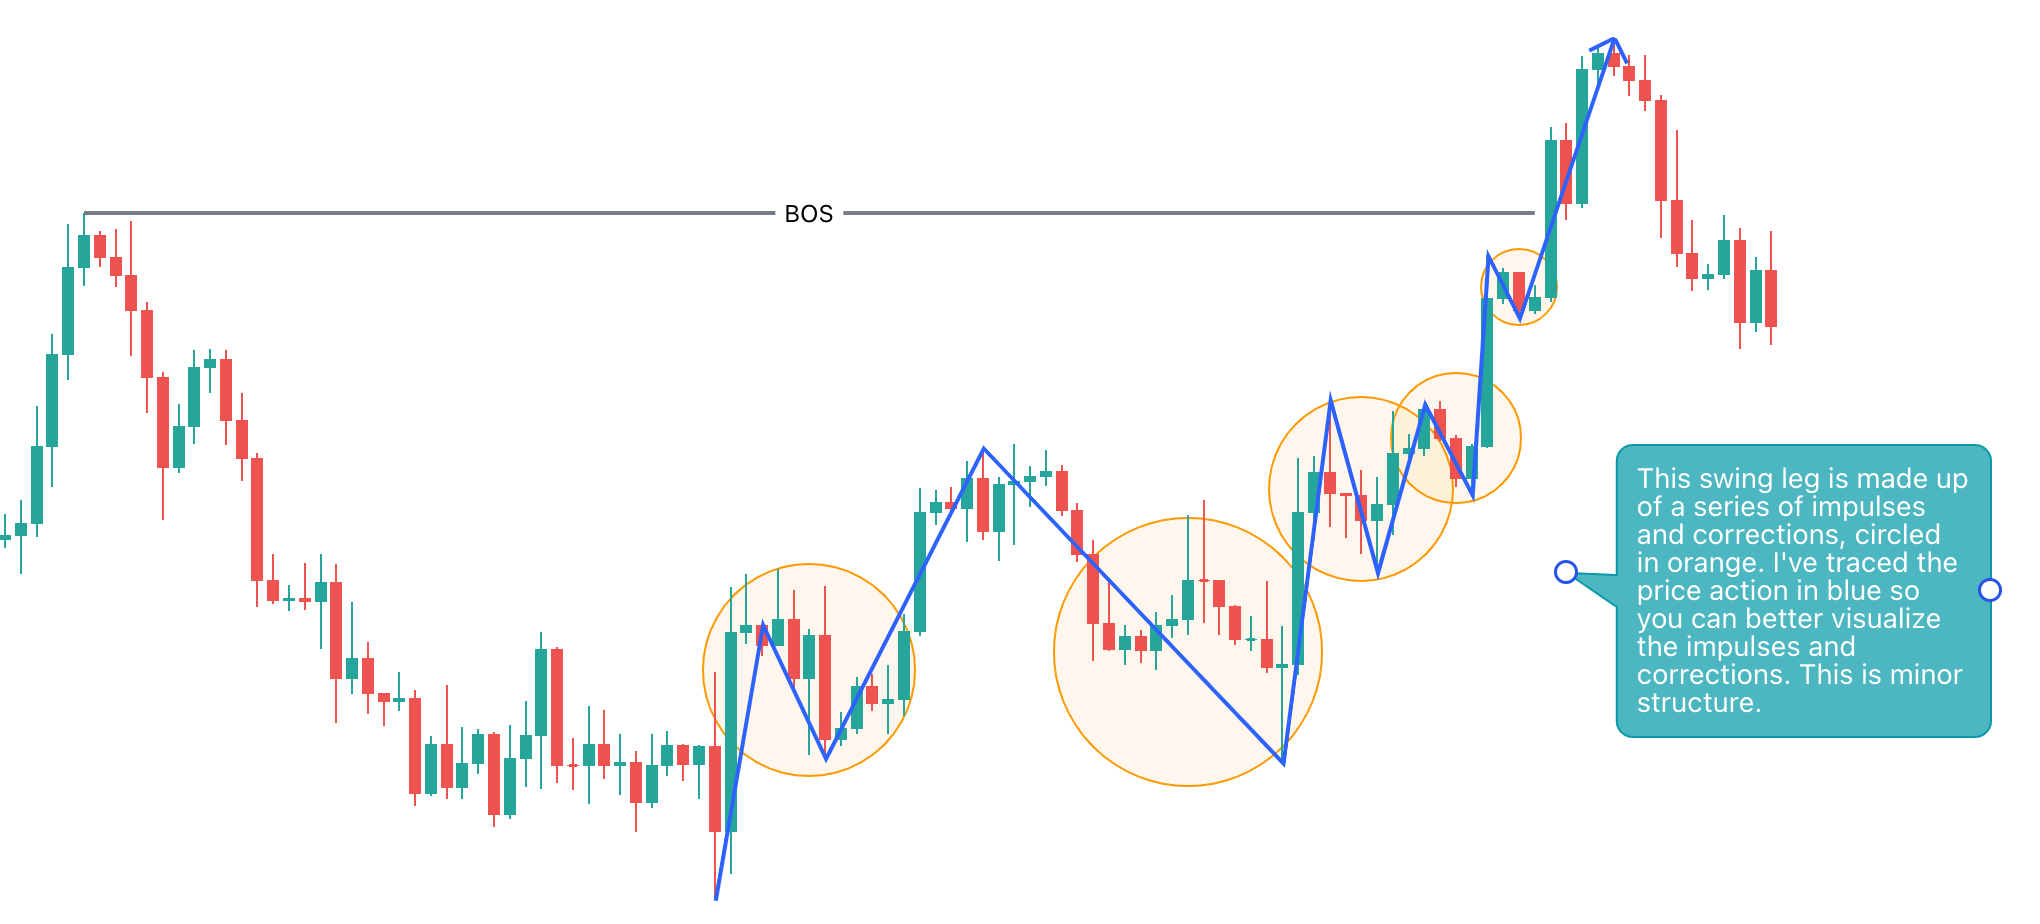
Minor Structure
Minor structure is the price action, a.k.a. impulses and corrections, that make up a swing leg. What is a swing leg? A swing leg is the impulsive move that breaks swing structure, either to the downside or the upside.
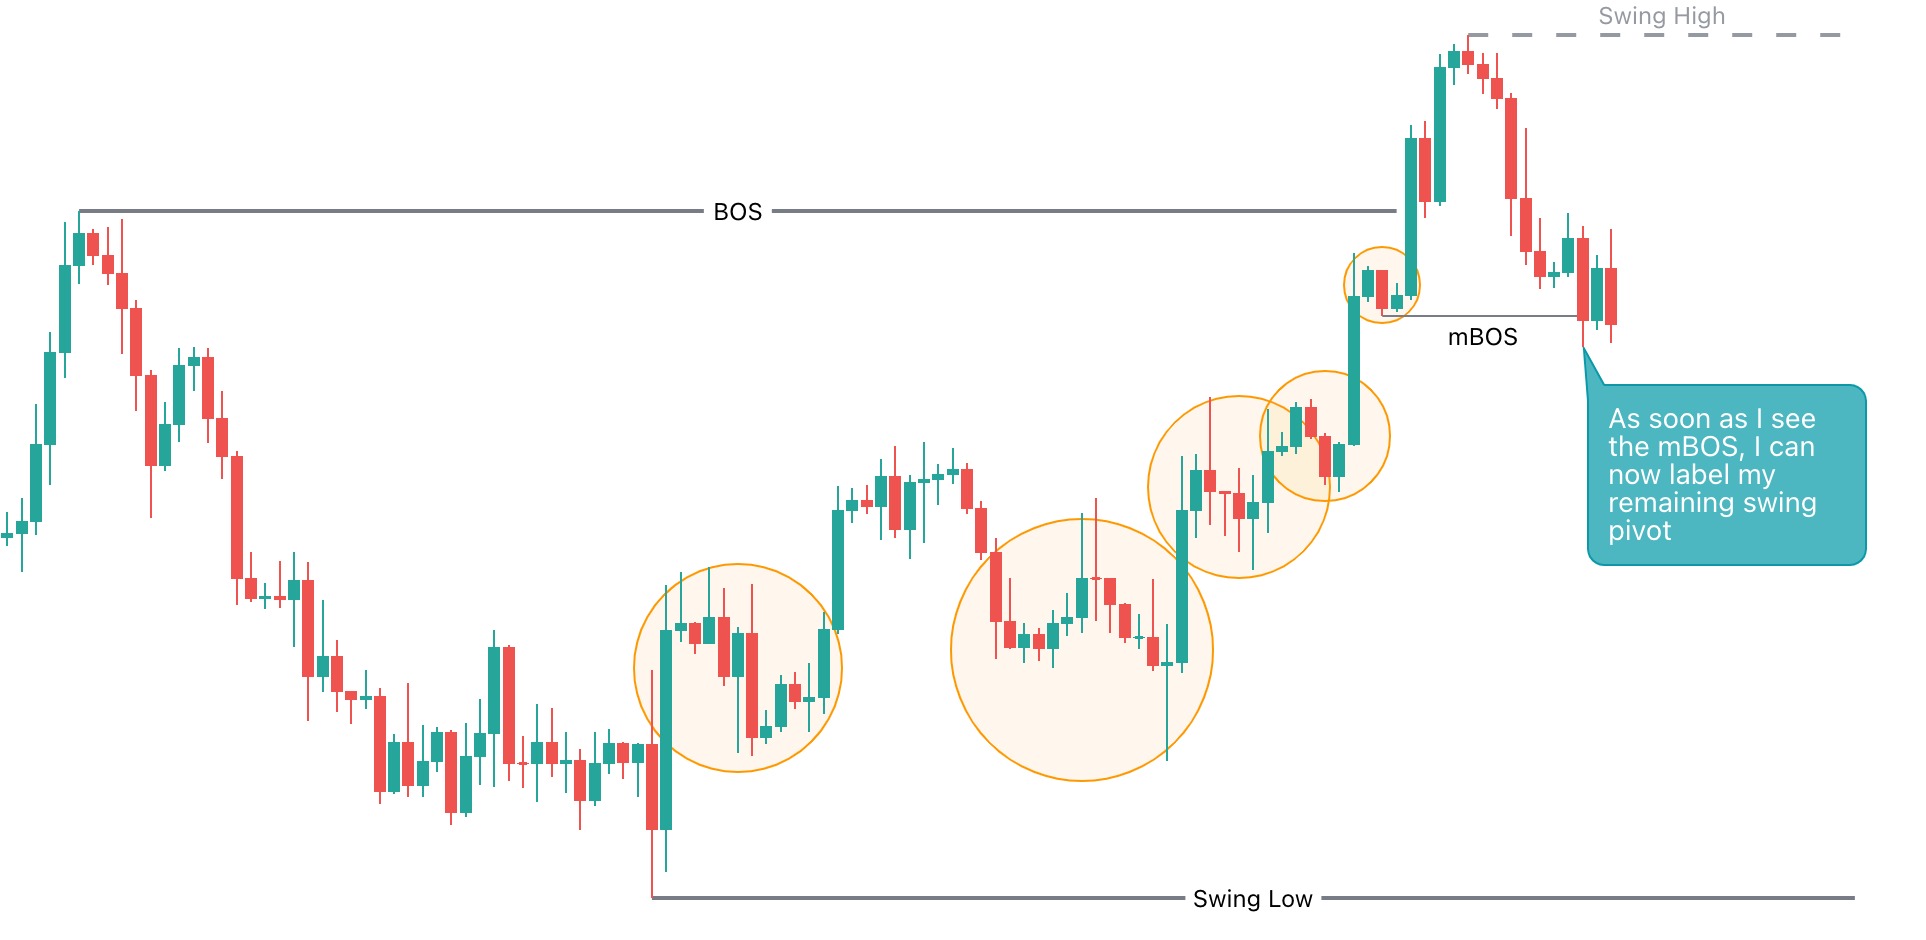
As soon as you see a break and close through one of these examples of minor structure, you have a valid mBOS. Once you identify a valid mBOS then you can confirm that price is now likely pulling back.
Now that you know how to confirm a pull back, let me explain the process of labeling your swing points once more:
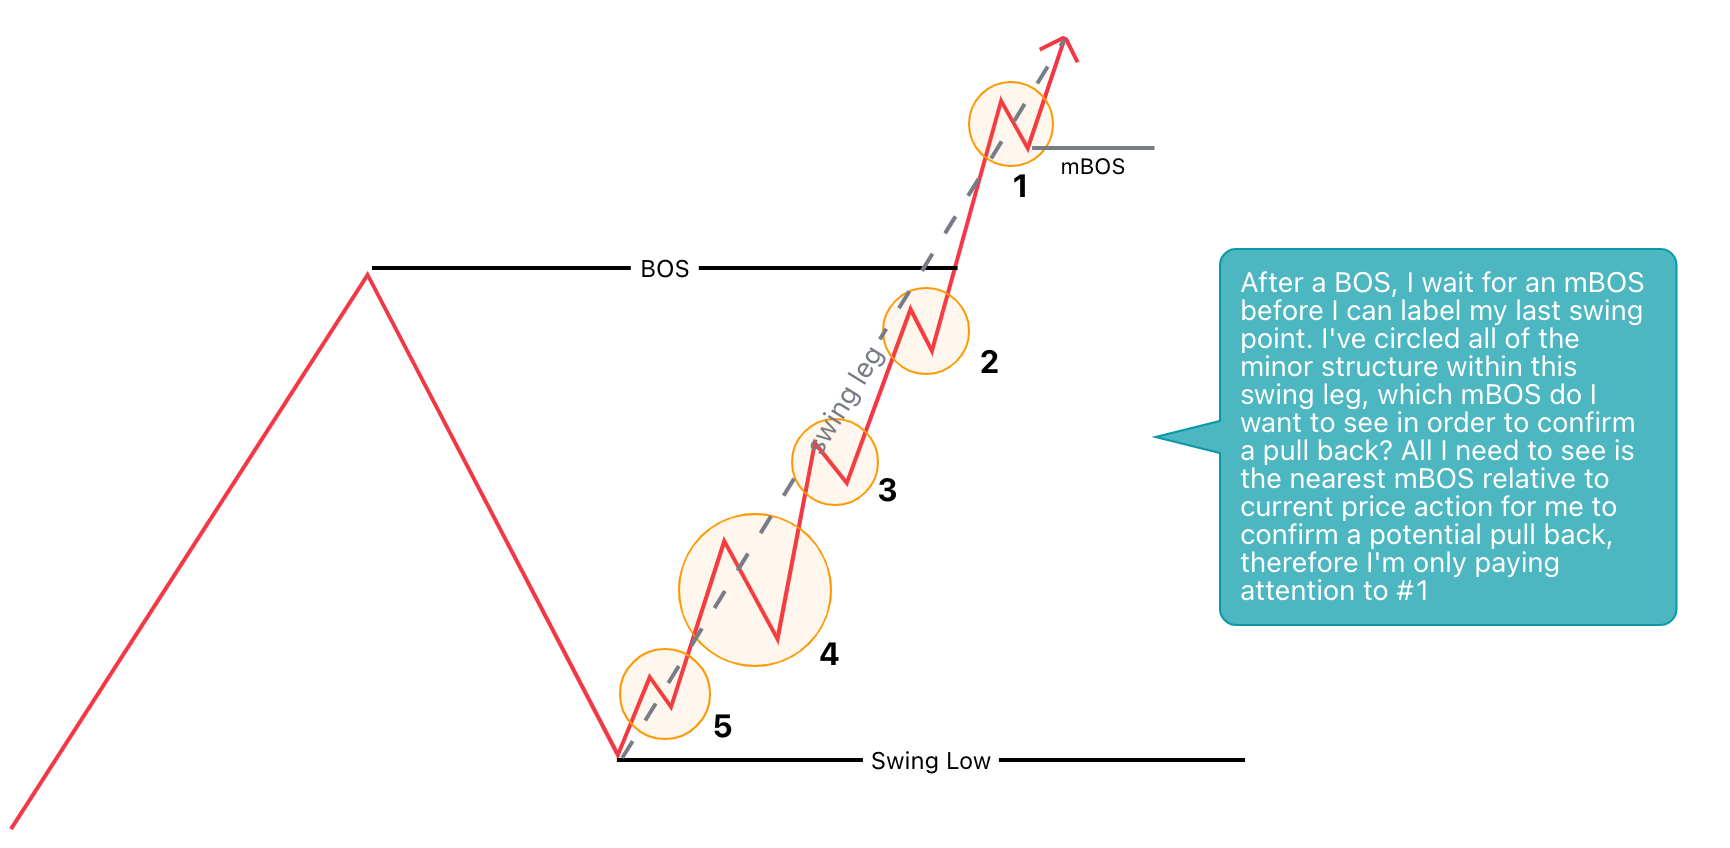
After you see a break-of-structure, you can label your first swing point
After you label your first swing point, look for an mBOS to confirm a pull back
After you confirm the pull back, you can label your last swing point
When you are looking for the mBOS, look for the nearest mBOS relative to price action.
Okay, now back to that “special case” I mentioned earlier — eventually there will be a time when price makes a strong impulsive move after a break of structure leaving behind little to no minor structure to trade from. Whenever this happens, I use another method to confirm a potential pull back.
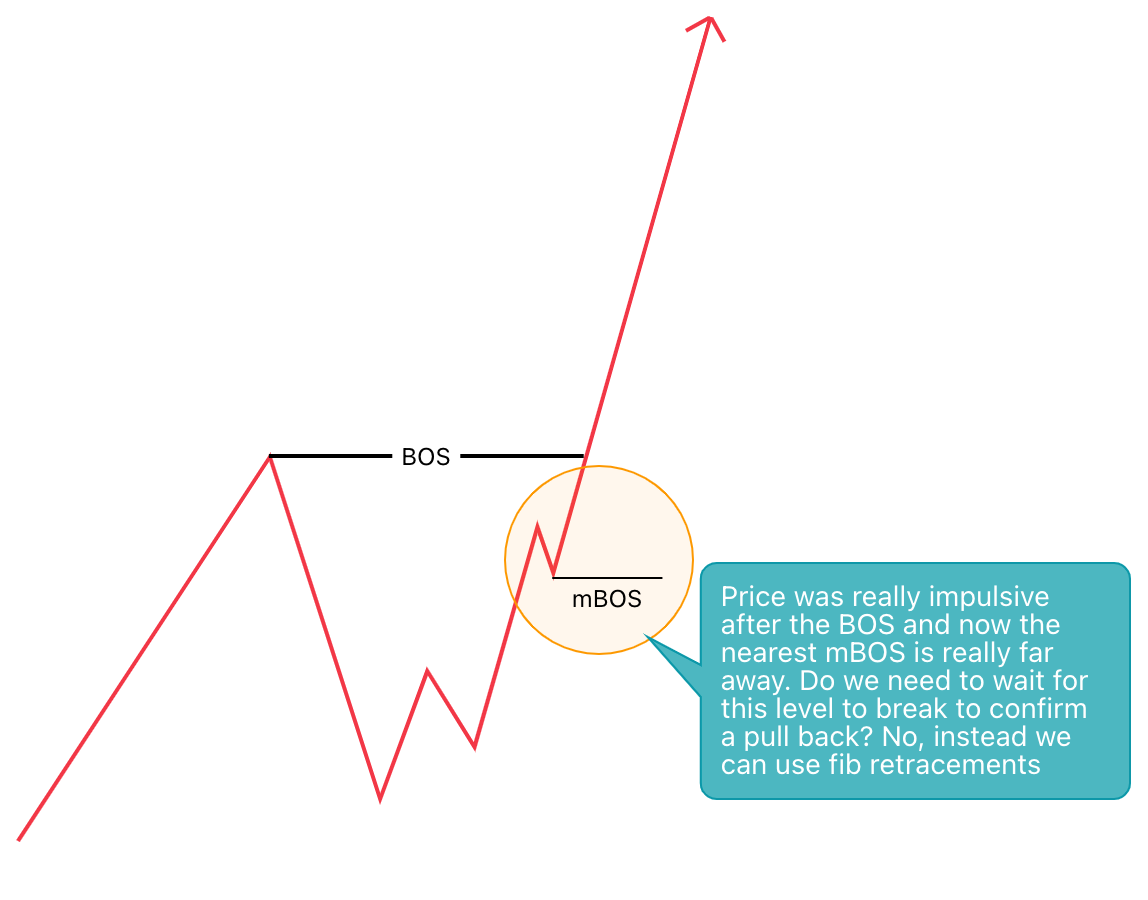
When price is impulsive, the last thing I want to do is trade against it. Instead I want to know that the impulse is over, or slowing down, before I start looking for counter-trades.
How can we tell when an impulsive move is slowing down?
Answer: The 0.236 fib retracement level can be used as a strength indicator for impulsive moves. When you see a candle close through the 0.236 level, this tells us that the impulse may be over and a pull back may be underway. If price fails to break through the first fib level then that usually means the impulse isn’t over yet. Therefore, I want to see a candle close through the 0.236 in order for me to feel confident that the pull back may be starting.
By now, you should know how to do the following:
How to find/ confirm a valid BOS
How to label your first swing point, after the BOS
How to confirm a pullback using minor structure, or fib retracements
How to label your final swing point
Swing Range
After you have successfully identified and labeled your swing high and swing low, you now have a well defined swing range. A swing range is the range between the swing high and swing low.
Remember those trend characteristics I mentioned earlier? — It’s time to take a closer look at those again. We are going to use these characteristics in order to predict what should happen within a swing range.
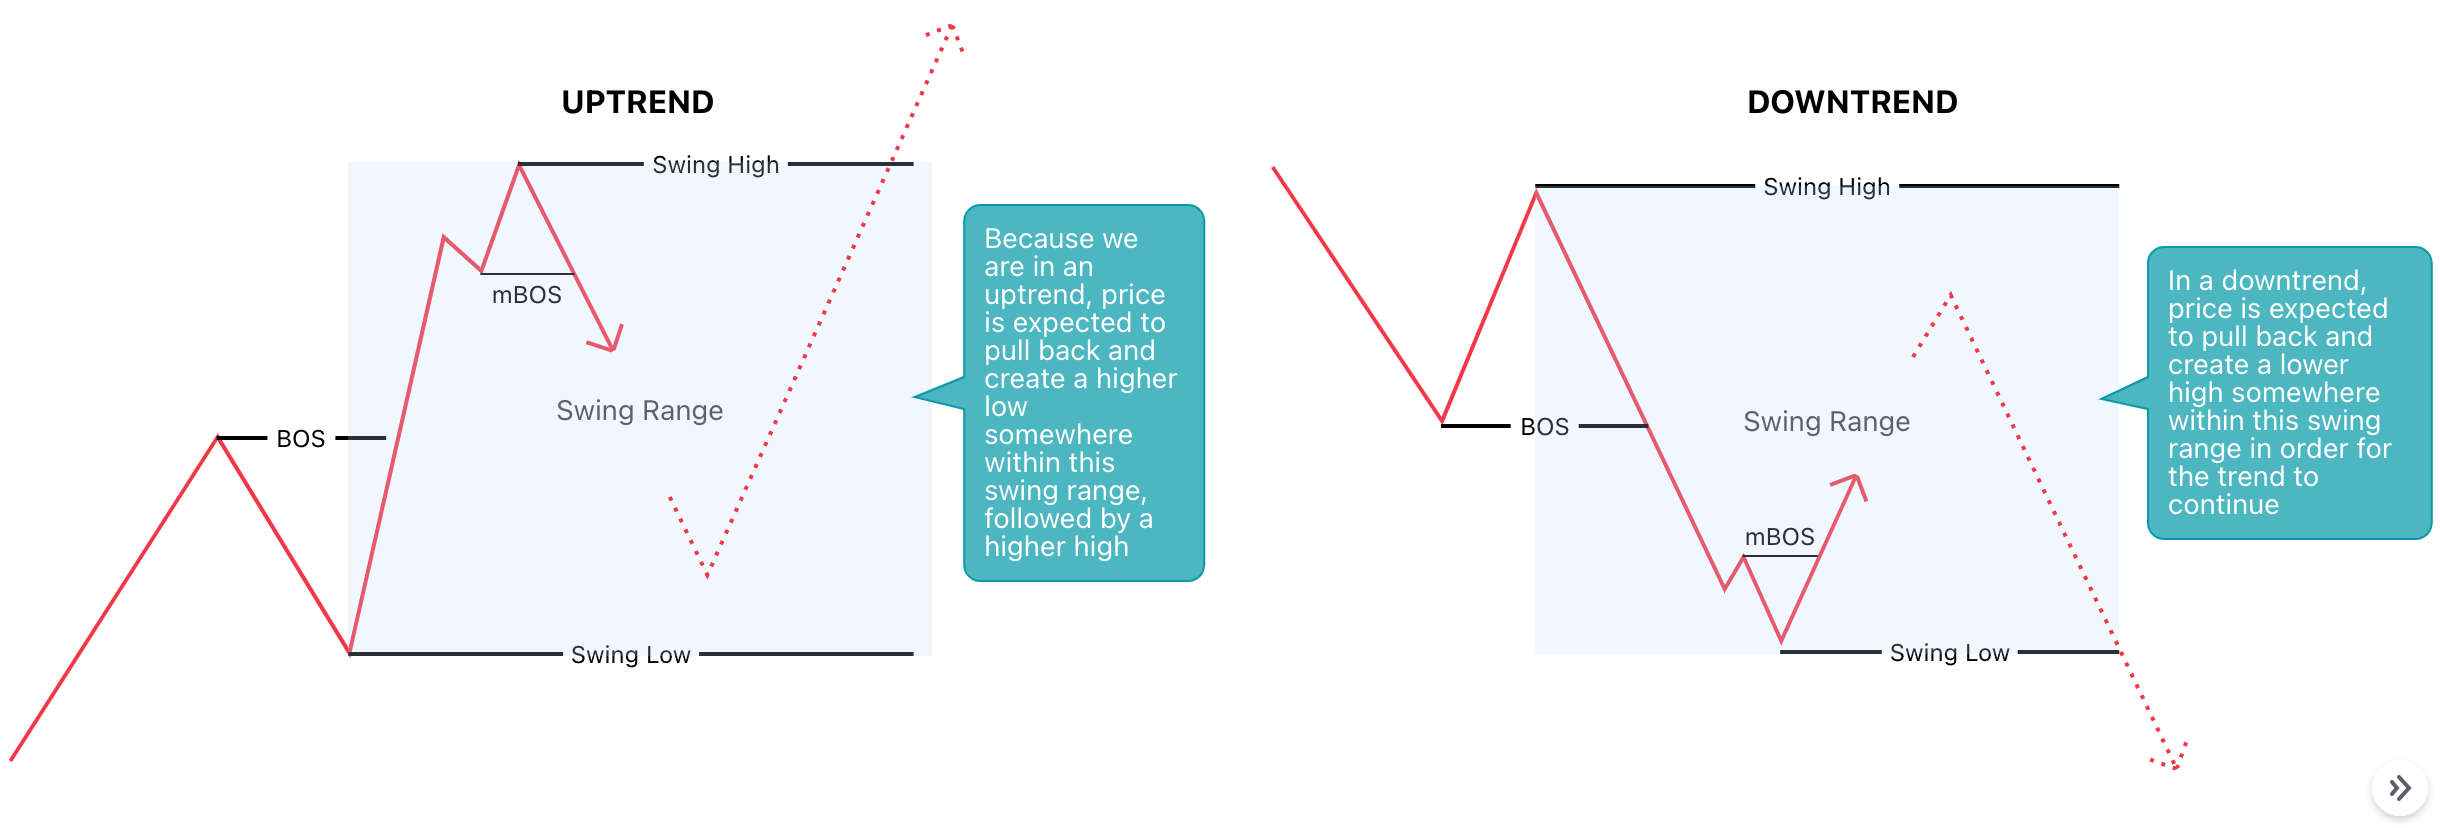
Every swing range has an objective.
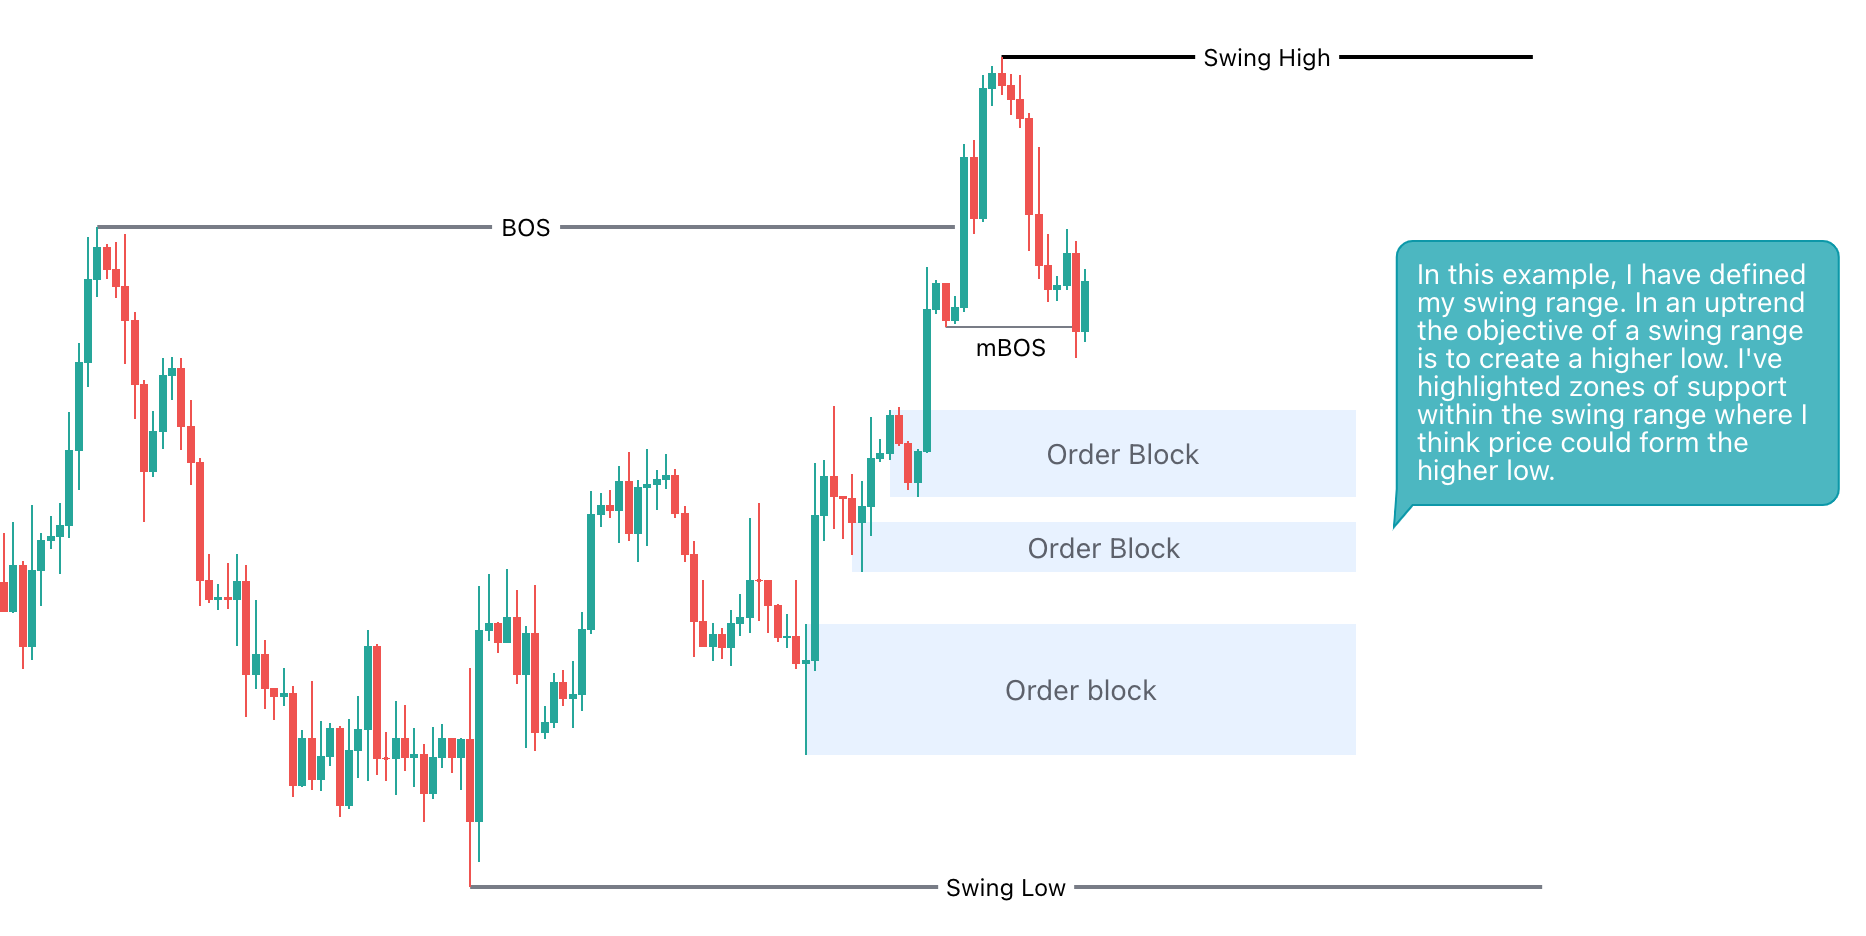
In an uptrend, the objective of a swing range is to create a higher low
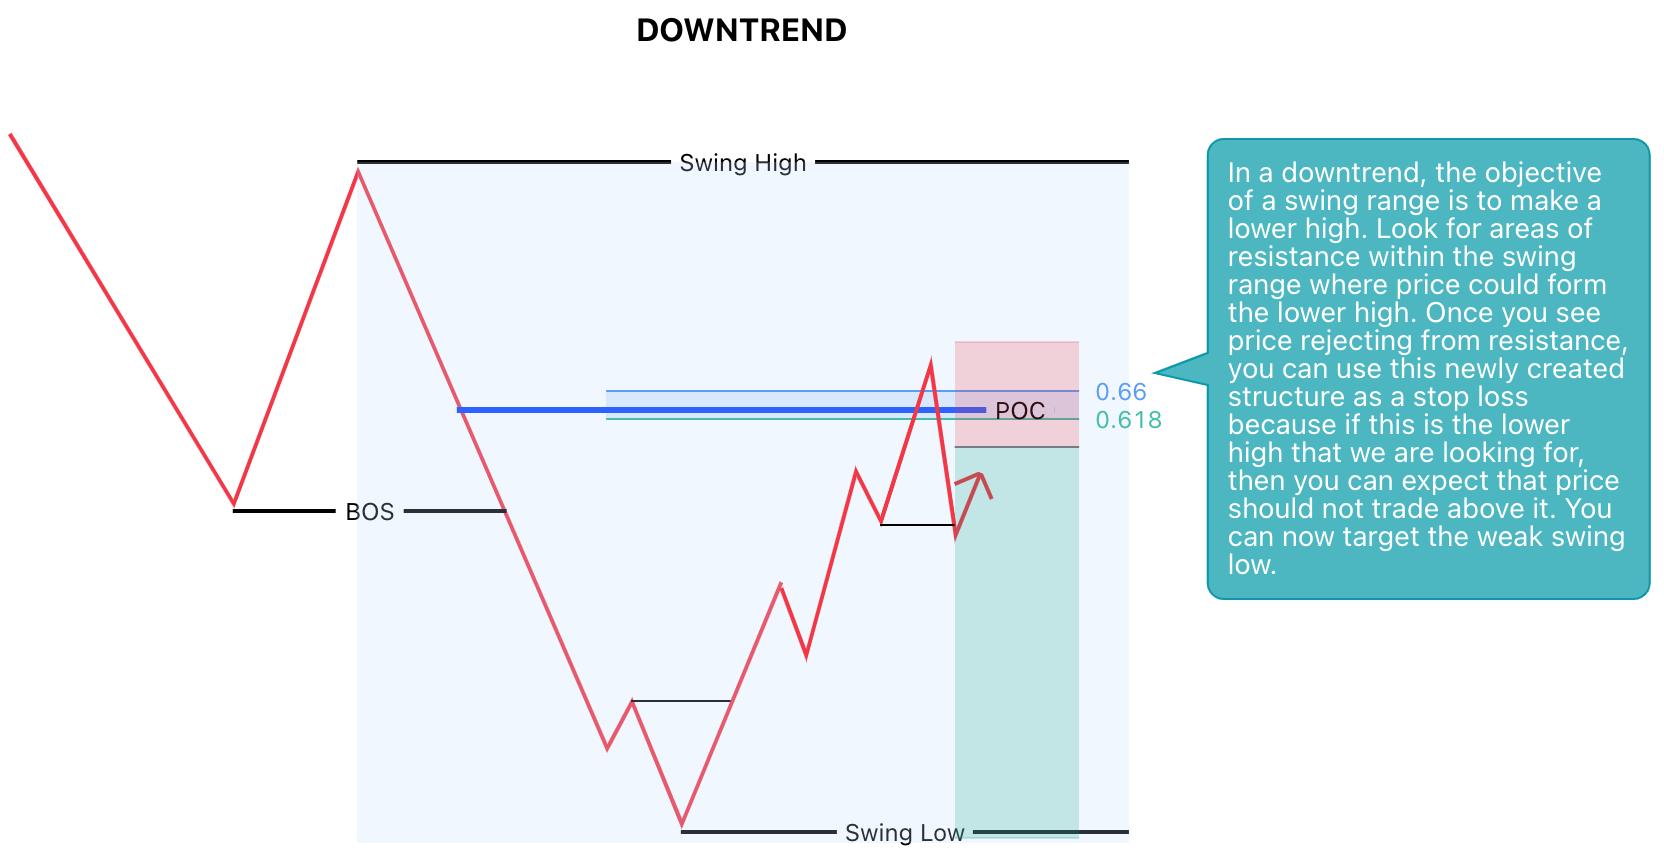
In a downtrend, the objective of a swing range is to create a lower high
By correctly labeling your swing range, and understanding its objective, you can now begin to predict the future price action within your swing range.
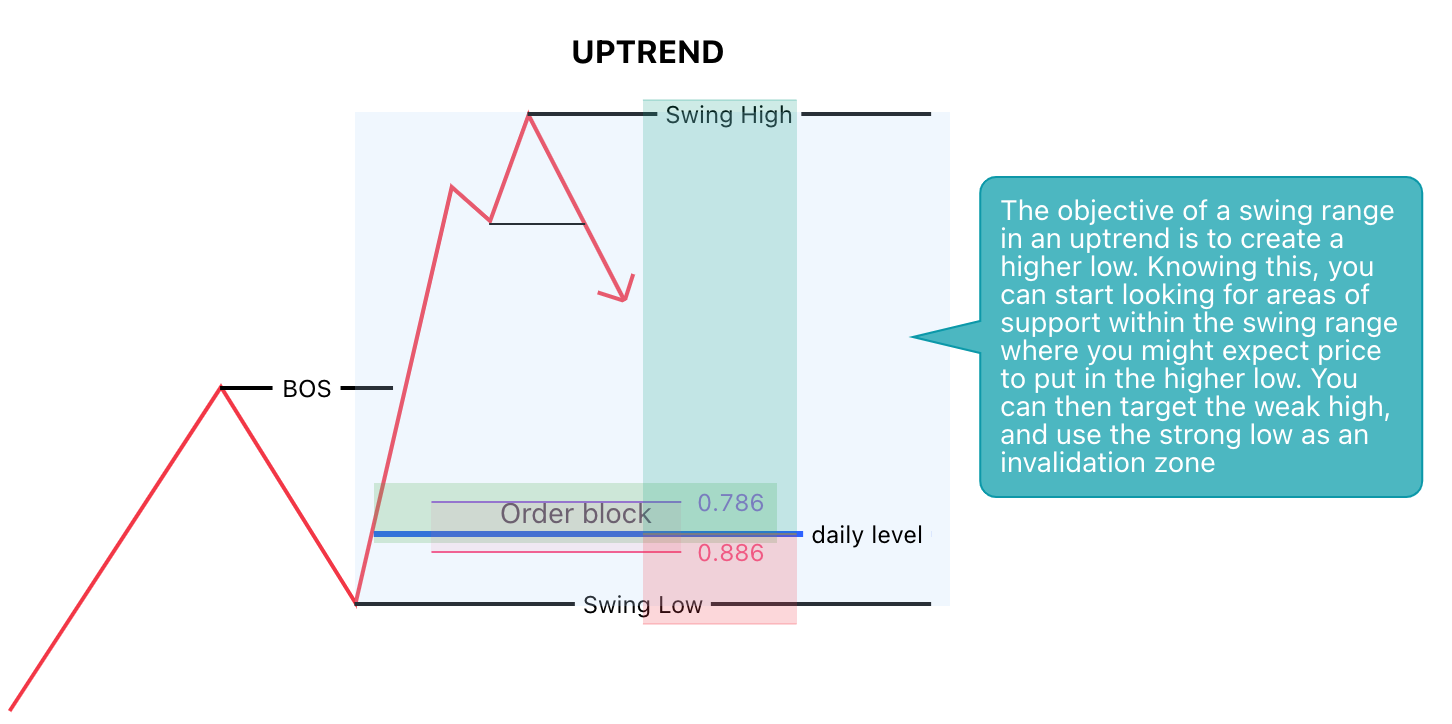
In an uptrend, swing highs are weak because they are expected to break at some point in the future. If you expect a swing high in an uptrend to break, that means you can start targeting these highs in your trading ideas.
What about a stop loss? — In a uptrend, swing lows are strong because in order for the uptrend to continue, price should not break below a swing low. Therefore, if you expect a swing low to hold, then that means you can use swing lows as an invalidation zone for your trading ideas.
The opposite is true for a downtrend. In a downtrend, swing lows are weak because they are expected to break in order for a lower low to form. When it comes to making a trading plan, you can target the weak swing lows and use strong swing highs as an invalidation zone for your trading ideas.
Here is an example of what a simple trading idea would look like after you’ve correctly labeled your swing range:
Eventually, all trends come to an end, and therefore its important to know how to spot a reversal in the market.
Change of Character
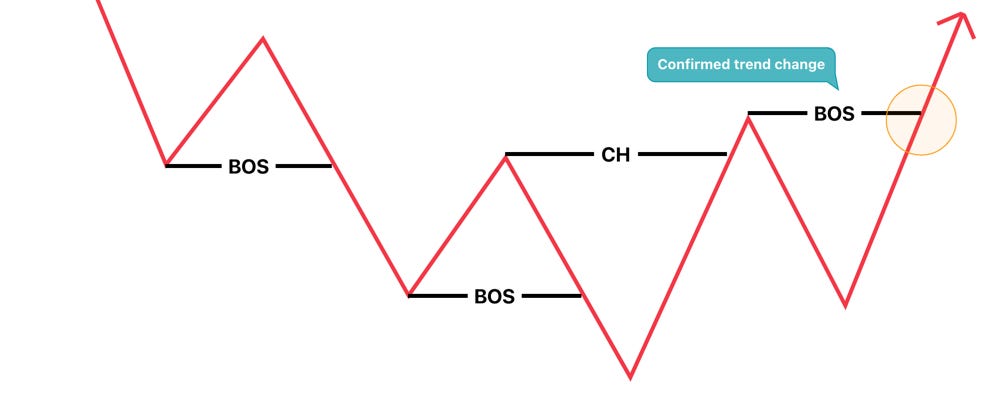
A change of character (CH), is the first indication that a trend may be about to change, however a true trend change is only confirmed after the next BOS.
Here is an example:
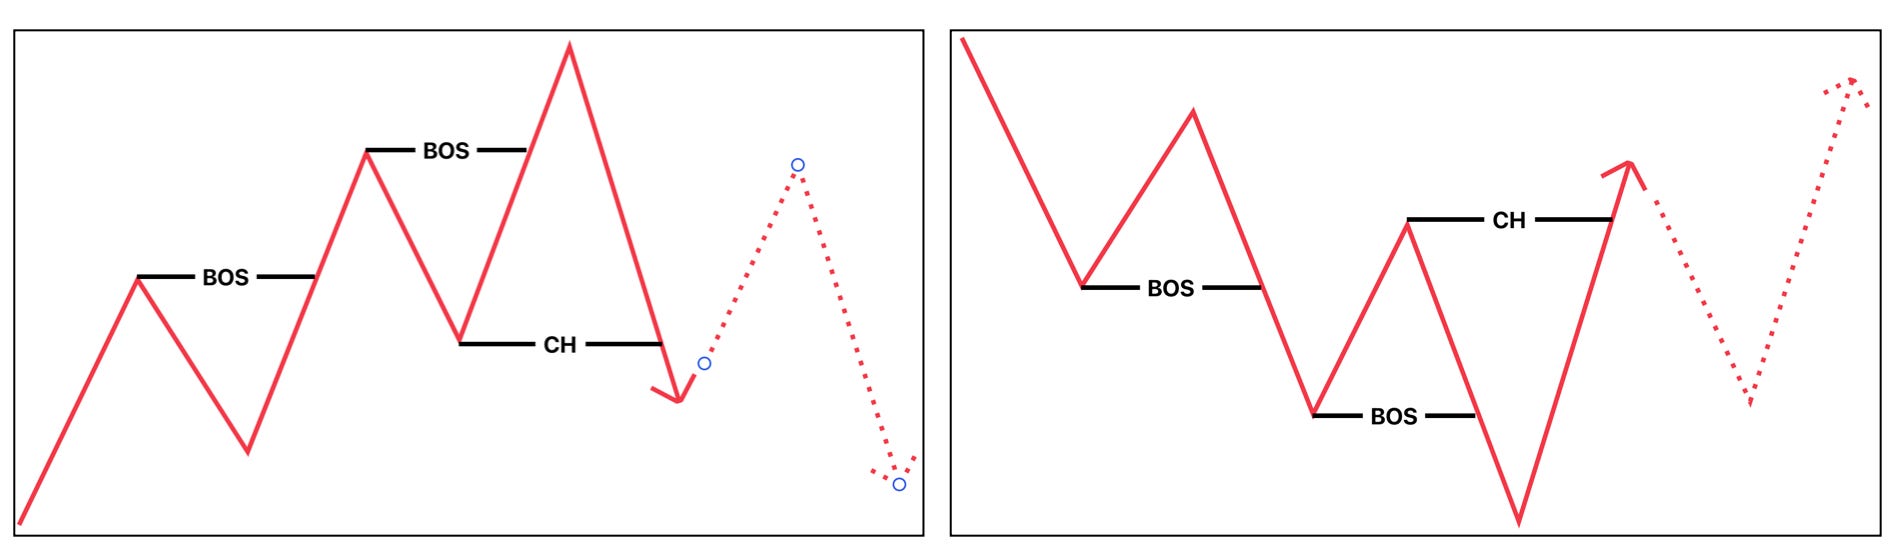
In an uptrend, I expect higher highs and higher lows
In an uptrend, I expect the lows to hold and the highs to break
When I see price break through a strong low in an uptrend, that tells me that the requirements for an uptrend are now invalidated. However, a downtrend has not been confirmed yet.
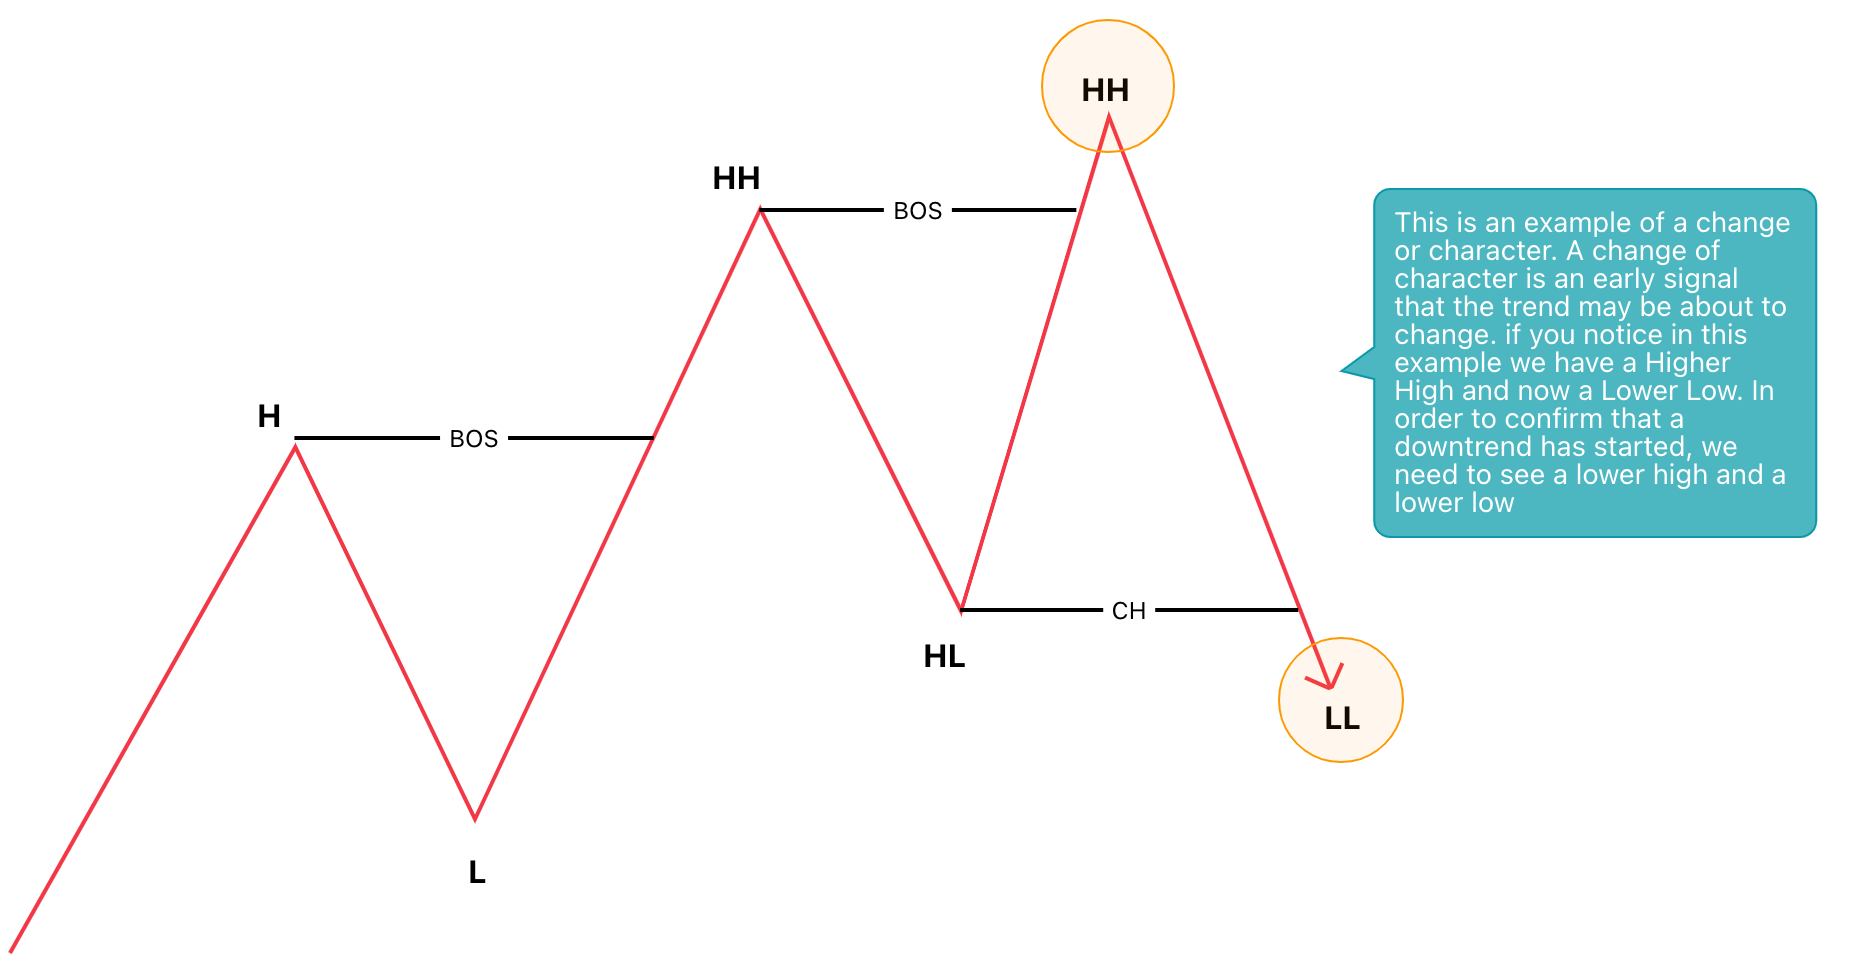
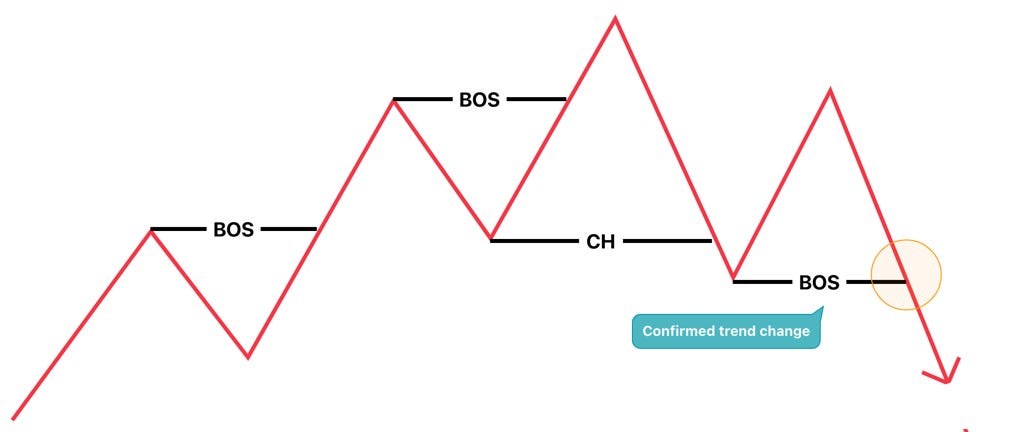
The same would be true in a downtrend. If price is making a series of lower highs and lower lows, we are in a confirmed downtrend. As soon as price puts in a higher high, we have now invalidated the requirements of a downtrend. A true trend change is confirmed once price continues to put in a higher low followed by a higher high.
Internal Structure
Internal structure is everything that takes place within the swing range. Just like swing structure — internal structure consists of trends, ranges, breaks of structure, swing highs, swing lows, swing ranges, etc.
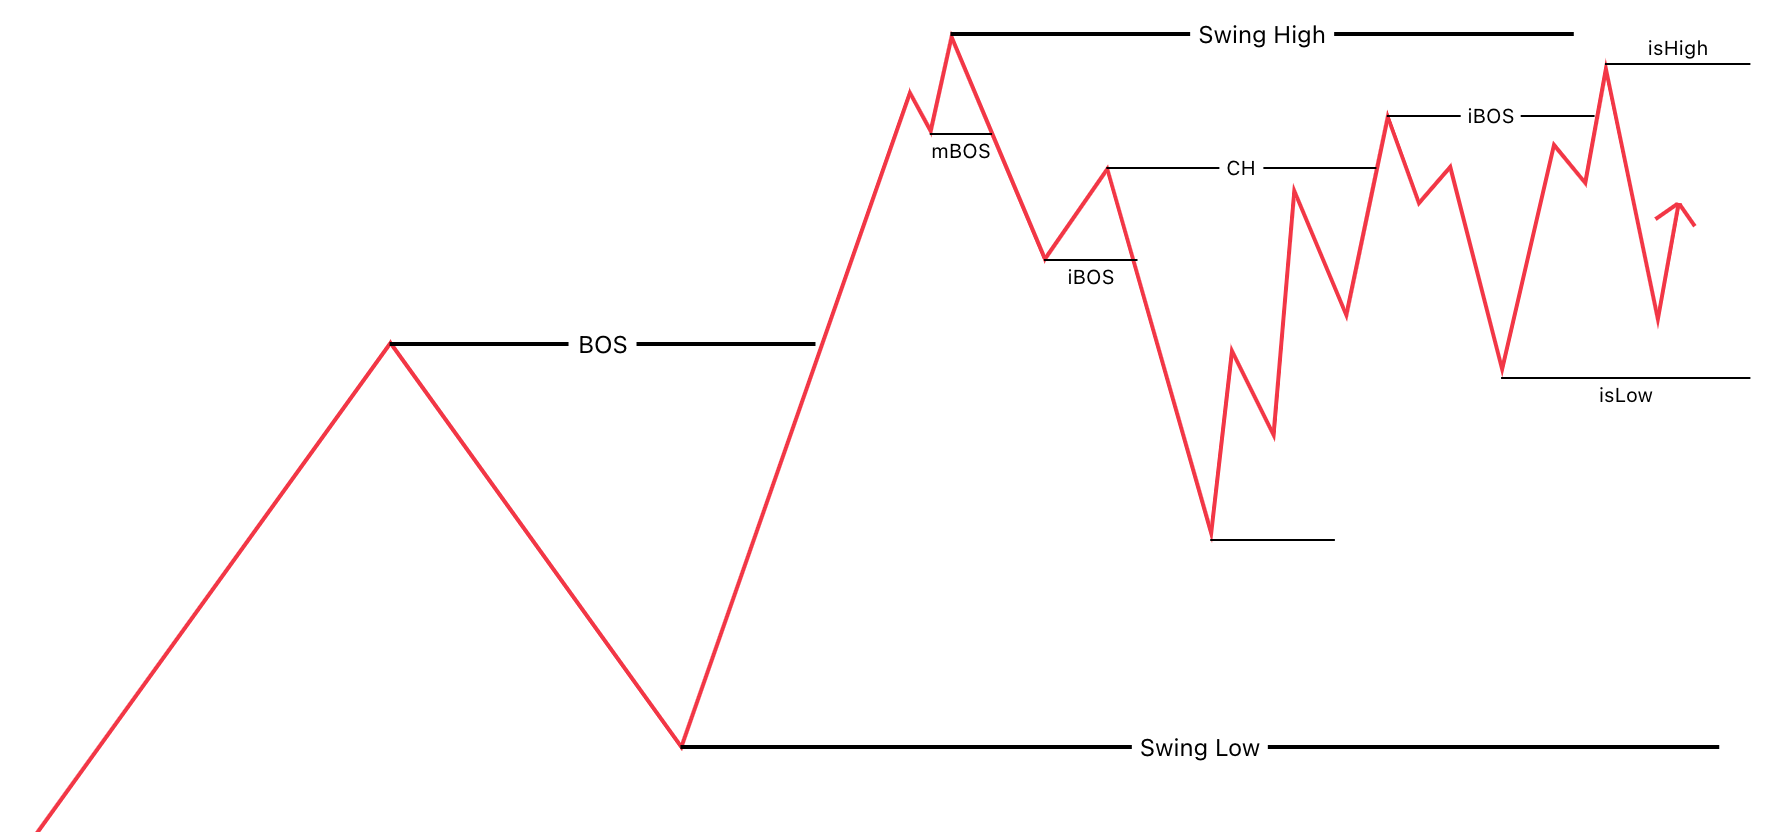
All of the rules that apply to swing structure, also apply to internal structure.
I want to see a candle body close in order to confirm a valid iBOS
After an iBOS I can label my first internal swing point.
After an internal pullback I can label my final internal swing point
Once I label my internal swing high and internal swing low, I have my internal swing range
After I identify the internal swing range, I can predict what is likely to happen next via the objective of the internal swing range
Something to keep in mind, is that internal structure can change very quickly. It can be very easy to get lost within internal structure. For this reason, I urge you to keep it simple. Tracking every move of price action within internal structure is not necessary.
Swing structure will always outweigh internal structure. Even if you can not keep track of internal structure accurately play-by-play, you can still be profitable.
The most important thing about mapping internal structure, is being able to identify when the internal structure and the swing structure are in agreement.
Internal structure is what I use to determine when the pull back is finally over. By knowing when the pull back is over, you will be able to find the highest R:R trade set-ups.
How do we know when the pull back is likely over?
Answer: When the swing range is in structural alignment with the overall swing structure.
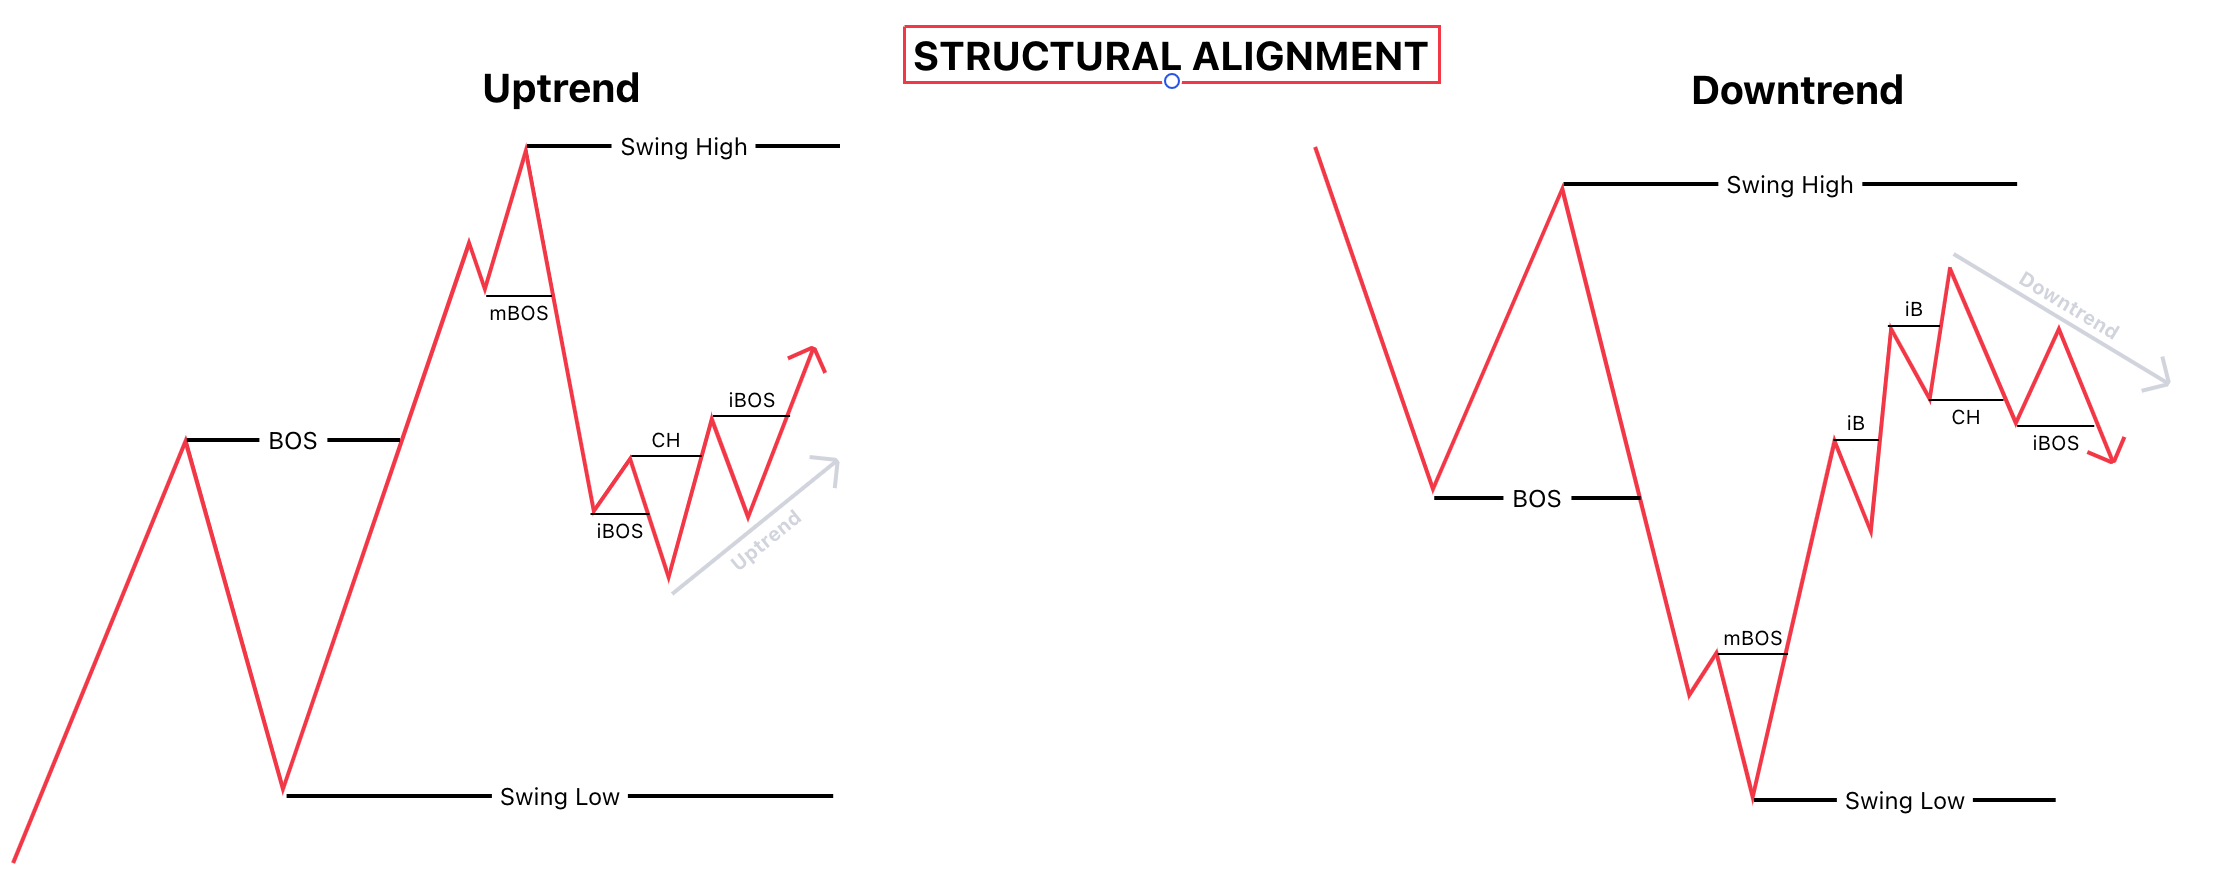
Structural alignment
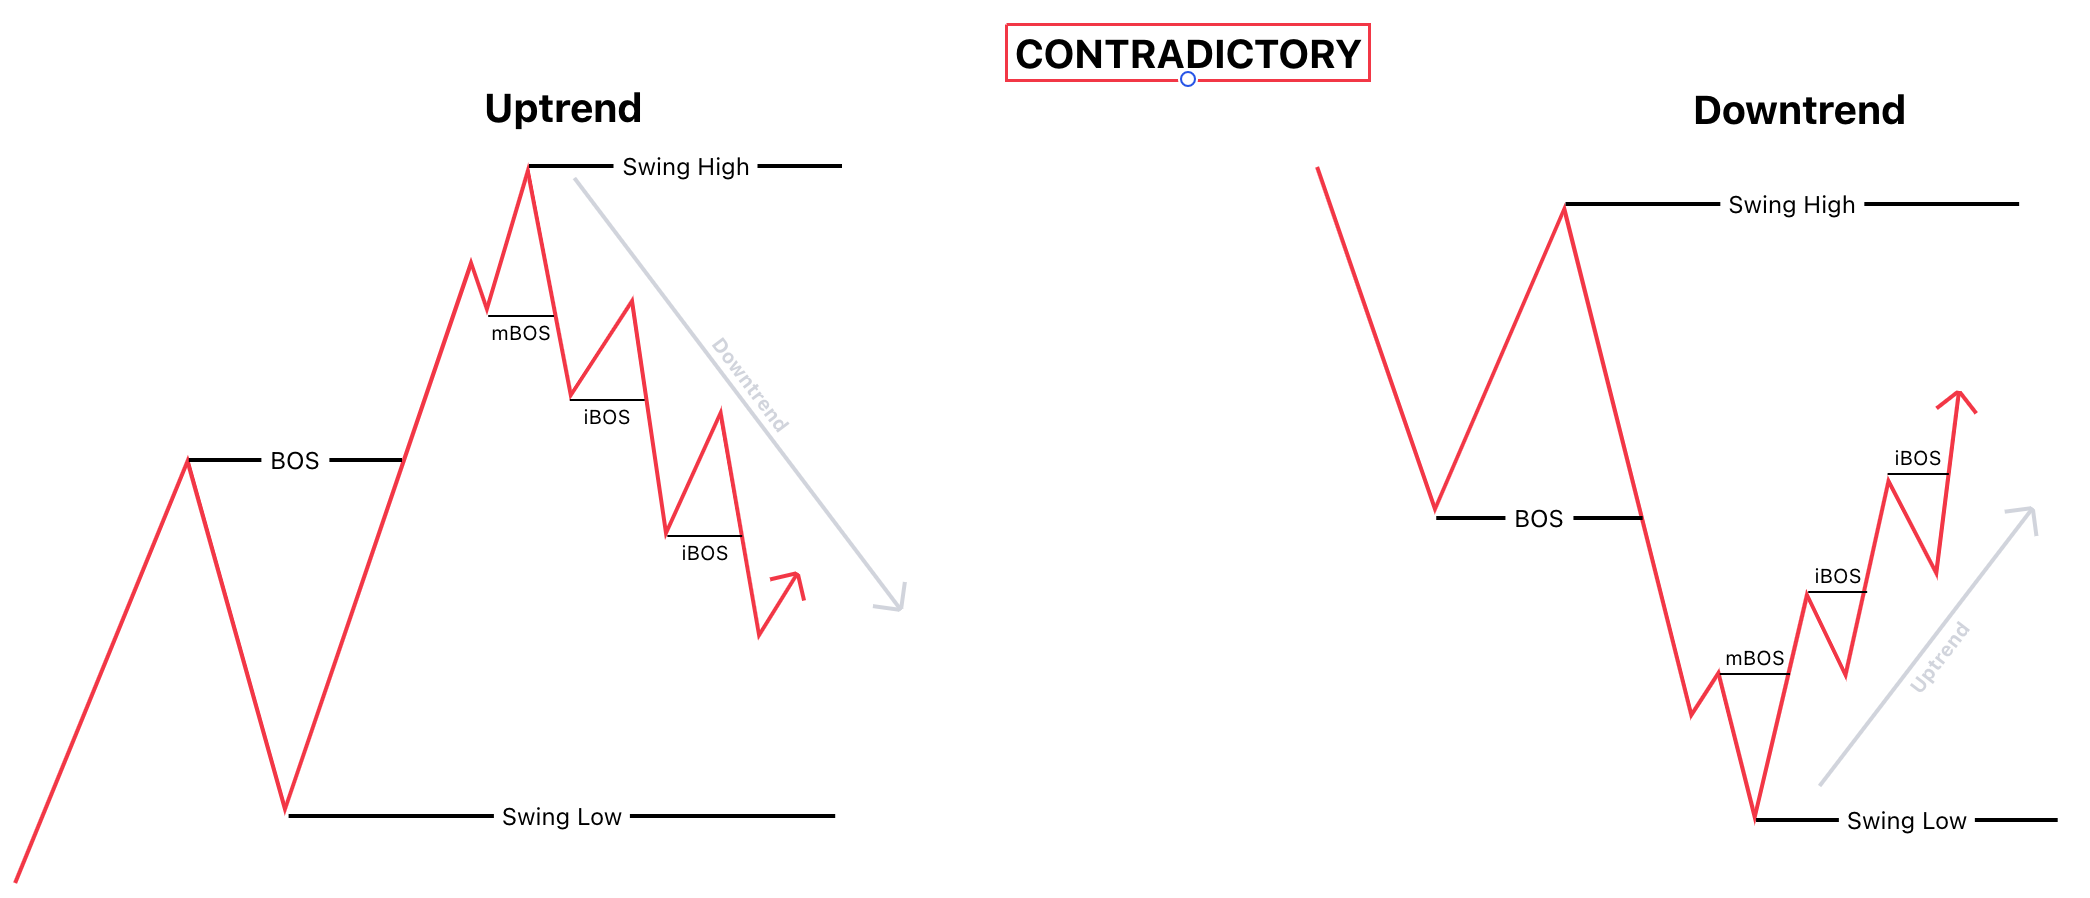
Structural alignment is when both the internal structure and the swing structure are moving in unison, in the same trend direction.
For example, when swing structure is in an uptrend, but the internal structure is in a downtrend, or vice versa, the swing structure is in a downtrend and the internal structure is in an uptrend — then price action is in contradiction to the overall swing structure.
When both the internal structure and the swing structure are aligned, meaning both the swing structure and the internal structure are in an uptrend, or vice versa, both the swing structure and the internal structure are in a downtrend — this is structural alignment.
Once the swing range reaches structural alignment, then the pull back is likely over, and price action is expected to fulfill its primary objective and take out the weak swing point.
Putting It All Together
By now you should know how to do the following:
Identify a valid BOS
Label your first swing point
Confirm a pullback in order to label your final swing point
Define your swing range + objective
Confirm when the pull back is likely over
We can now use all of this information towards developing a trading plan.
Swing Range Trading Strategy
The goal of this strategy is to catch the higher low within a bullish swing range, and/ or to catch the lower high within a bearish swing range.
Criteria: Price enters a high probability S/R zone within the swing range
Entry Trigger: Low timeframe trend change within S/R zone
Stop Loss: Beyond low timeframe strong swing structure
Target: Swing range weak structure
Timeframe: 4H or 1H
Execution Timeframe: 15m or 5m
These are the rules of the strategy, in order:
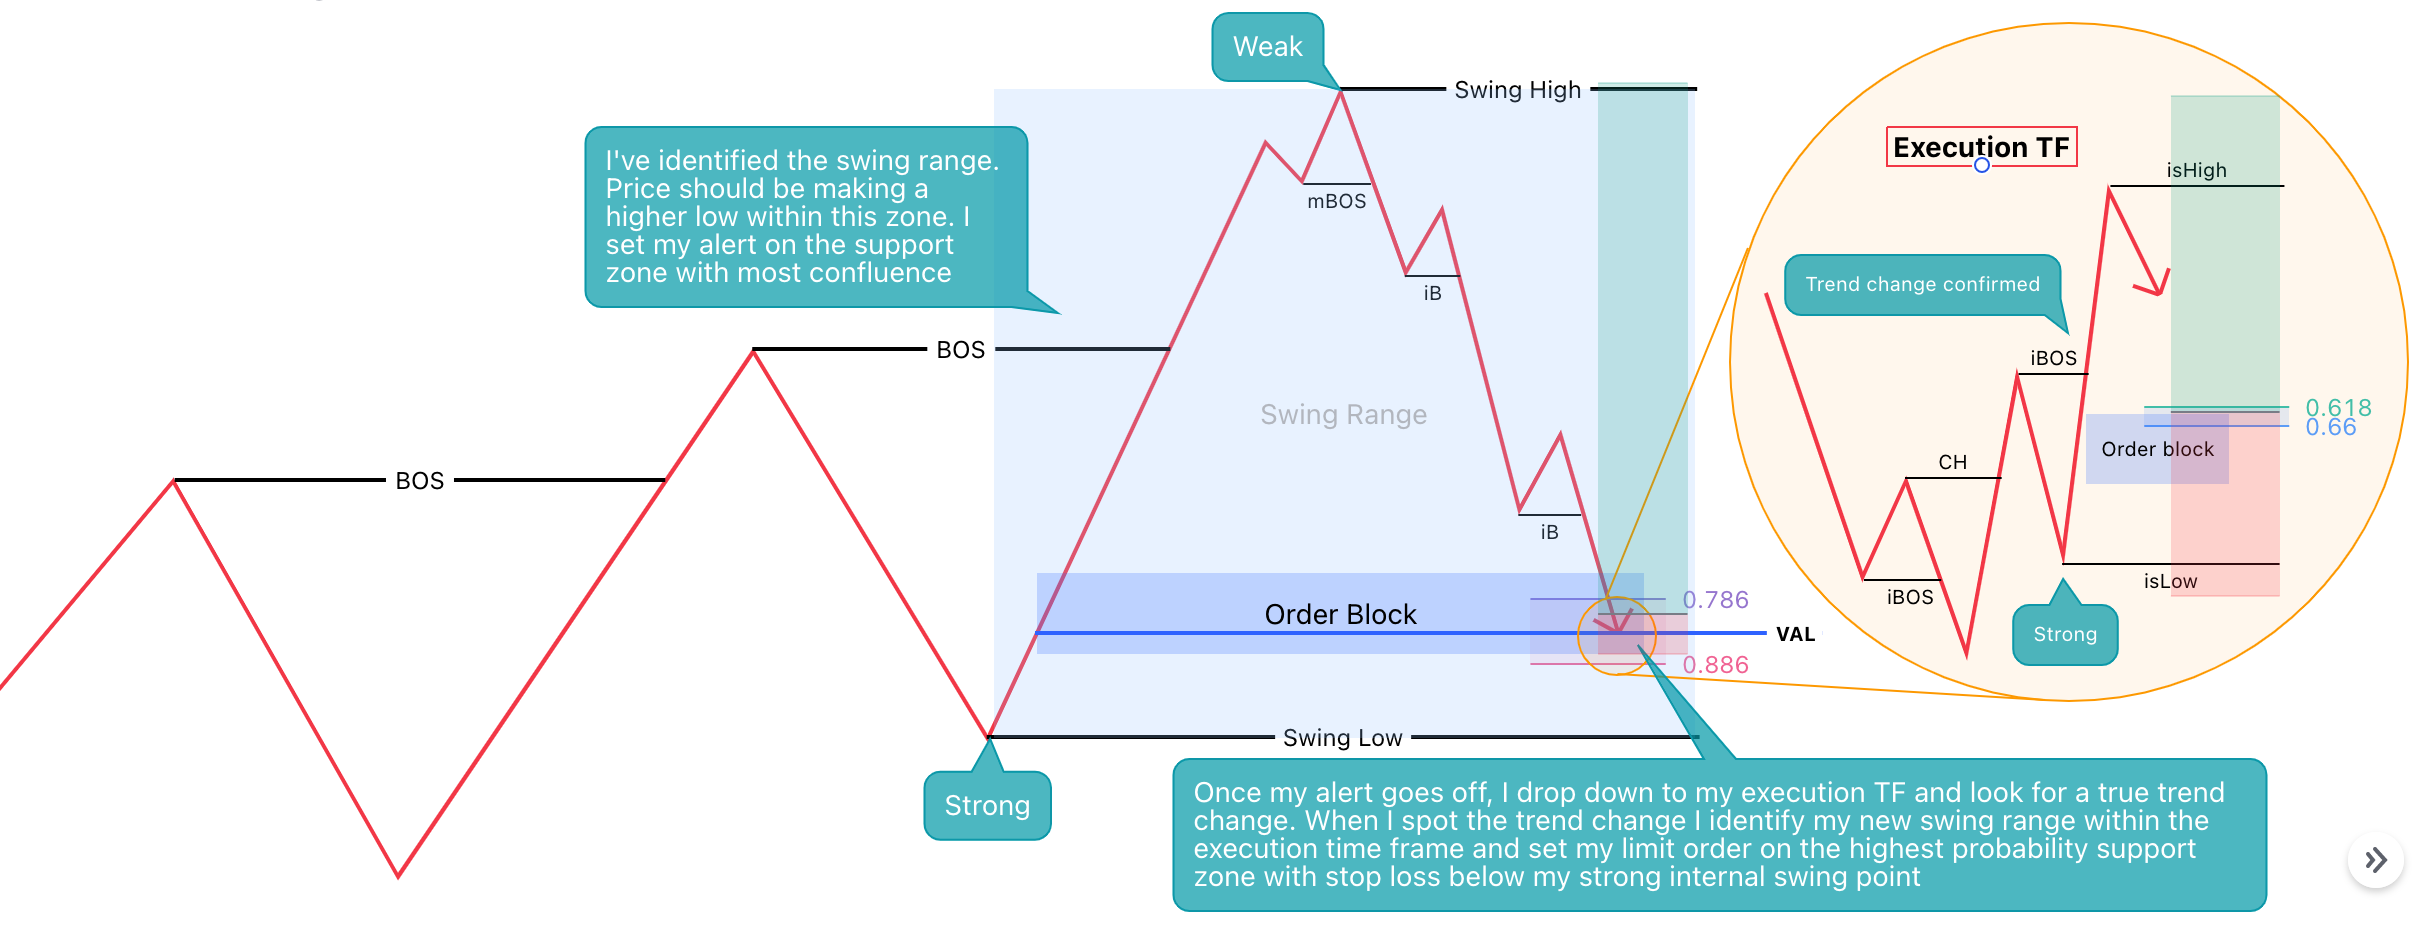
Identify the swing range on your main timeframe (4H or 1H)
Label the strong swing point and the weak swing point
High light all of the areas of support/ resistance that exist within the swing range
Set your alerts on these S/R levels
Wait for price to enter these zones
Once your alert goes off, drop down to your execution time frame and look for a true trend change
When you see a true trend change on the lower timeframe, repeat steps 1-3 on your execution timeframe.
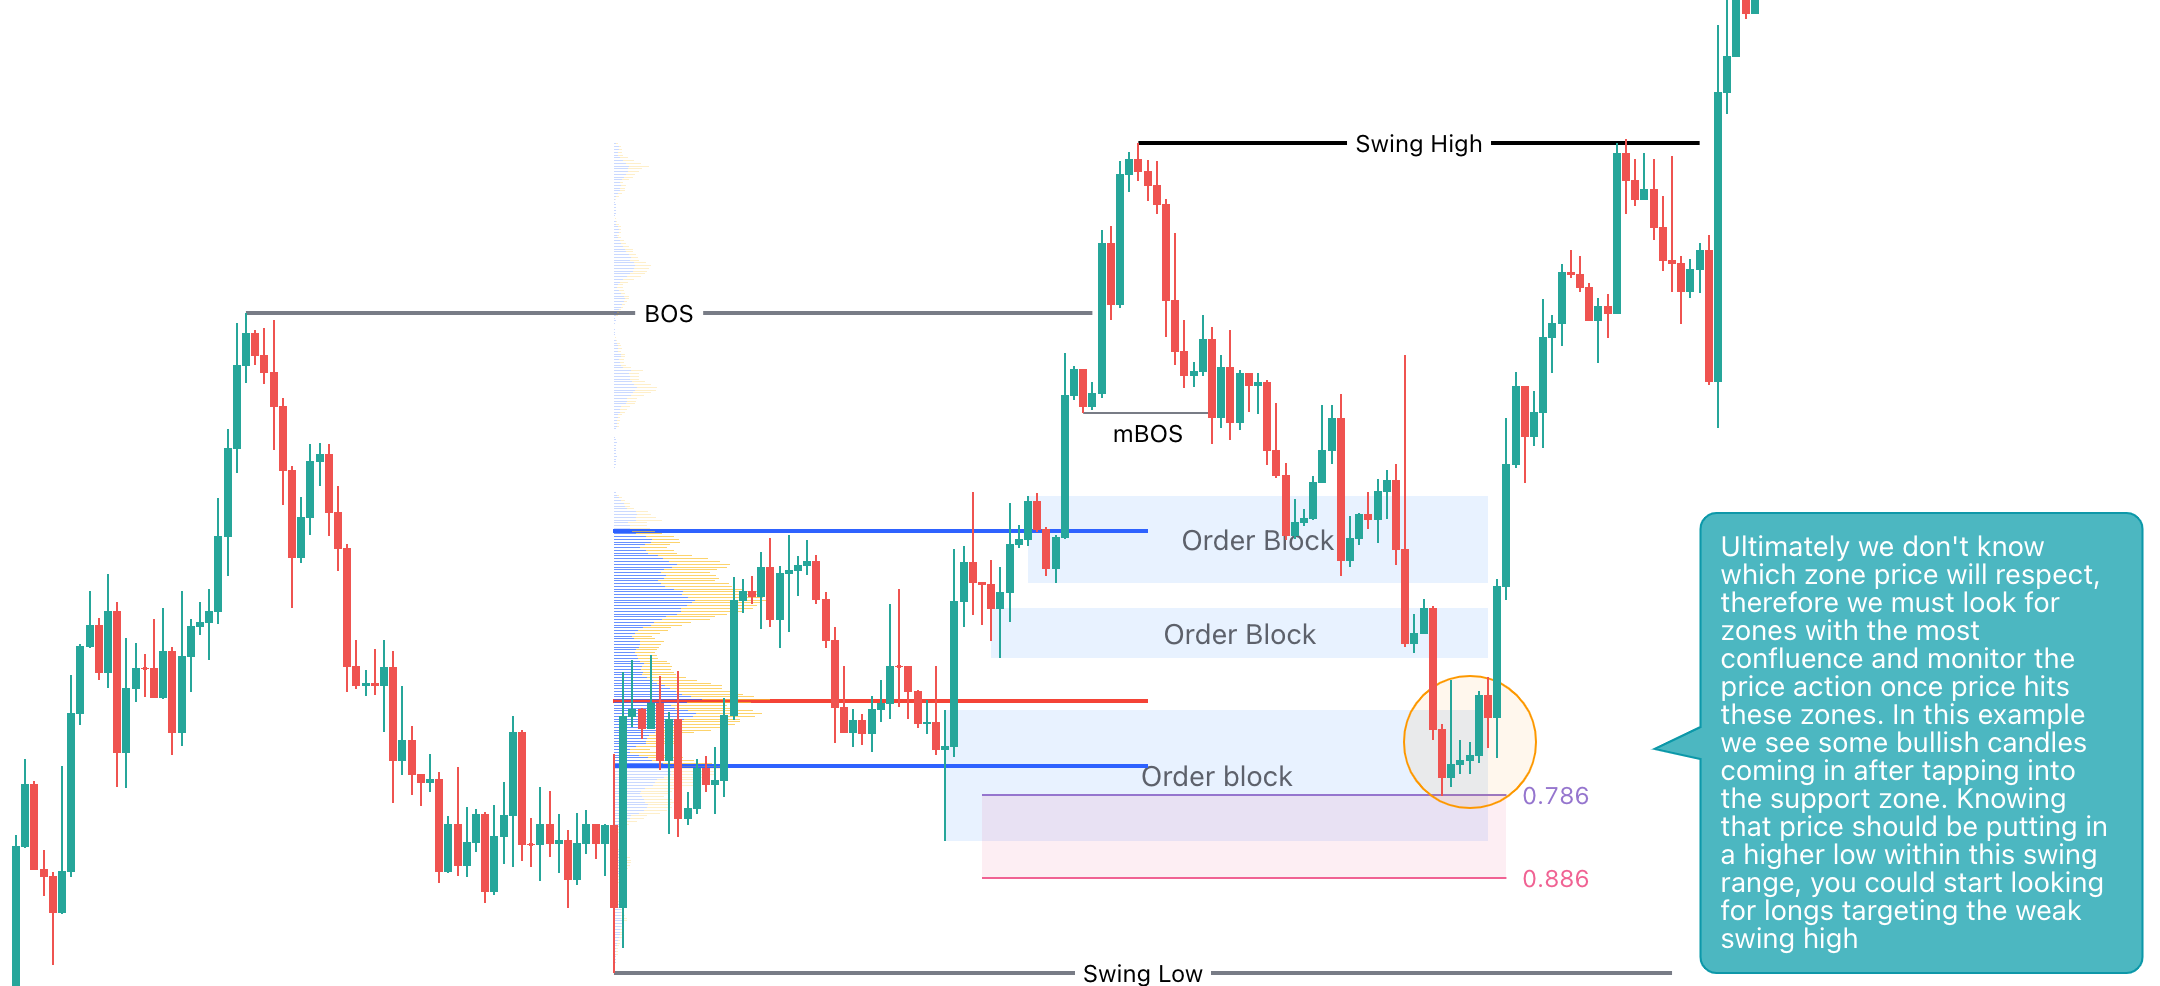
Set a limit order on the S/R zones that have the highest confluence within your execution time frame.
Set your stop loss outside of the strong internal swing point of your execution timeframe
Target the weak swing point of your main timeframe swing range
The above rules must be followed in order. Do not skip a step.
Treat this as a check list. Once you complete step one, cross it off and go onto step two. Once you complete step two, cross it off and go onto step three, etc.
Here is what this would look like in action:
There you have it.
This is a complete guide to how I use mechanical market structure in order to predict price action and form trade ideas.
I recommend reading this article several times through. I even recommend taking your own hand written notes to ensure the best possible understanding of each topic.
The Mechanical Market Structure video tutorial is available for all premium subscribers, here.
Understanding market structure has completely changed my trading. I truly hope this approach has the same effect on you, as it did for me. In later posts I plan to break down each of the topics listed above into further detail. Especially internal structure and fractal structure.
Be sure to leave me a comment with your thoughts below.
I appreciate your continued support, and as always, thanks for reading!
Mr. E
Thank you kindly! I’ve been enjoying writing about something I’m really passionate about so it helps when others are benefiting from it as well 🙏🏼
Very well written. I enjoy reading your articles a lot. Thank you very much for the time and effort you put into this.